 BubbleMarkets
How to Use a Sector Rotation Heat Map to Spot Market Shifts

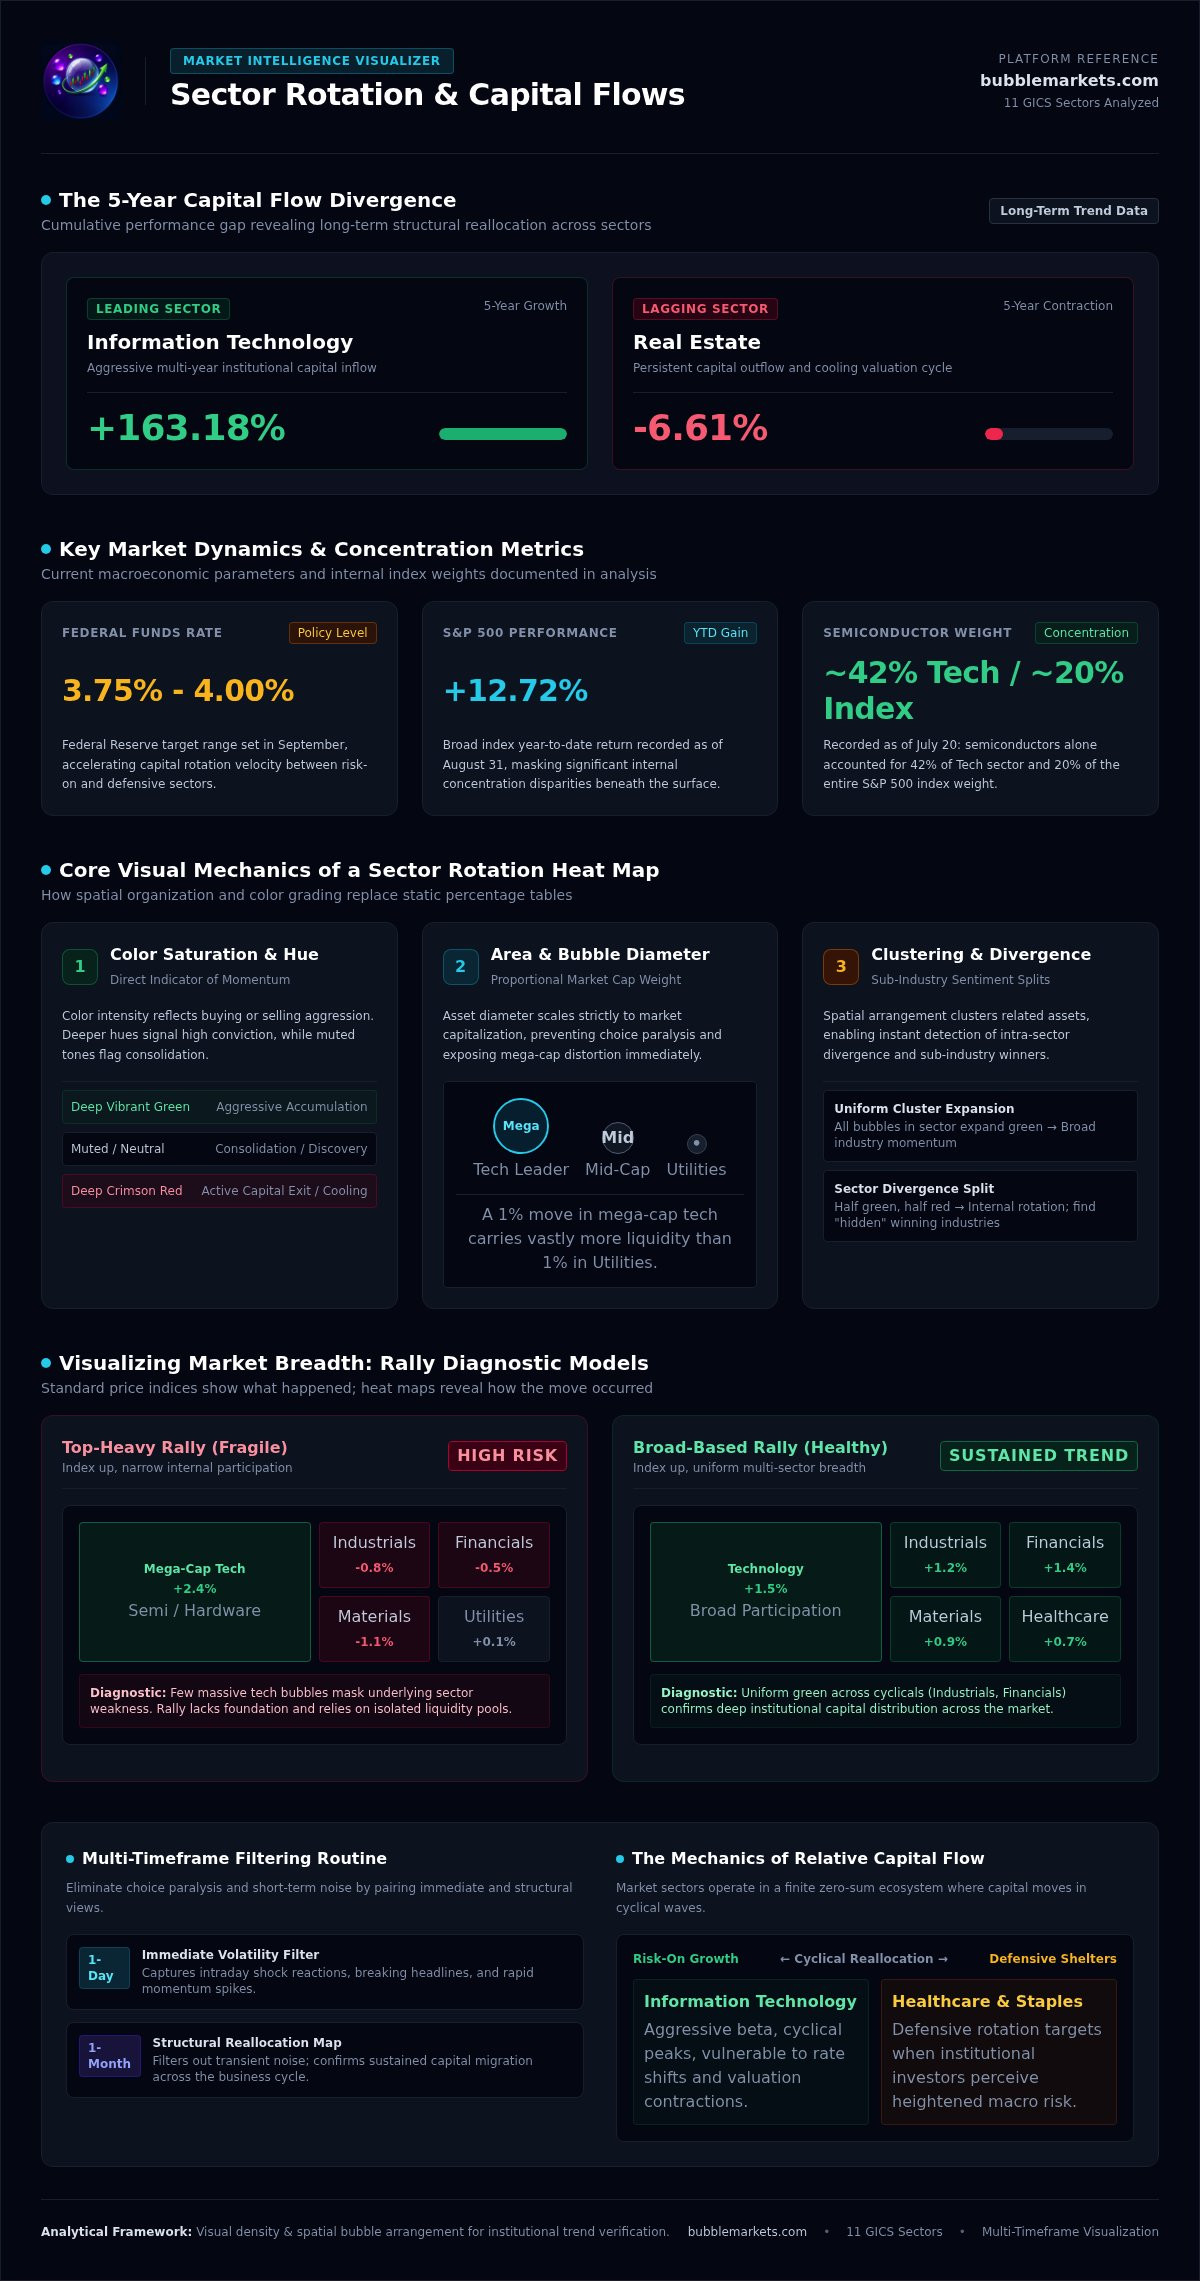
Over the last five years, Information Technology has surged by 163.18 percent while Real Estate has declined by 6.61 percent. These massive performance gaps don't happen overnight; they're the result of gradual capital flows that are often invisible in standard news headlines. Monitoring all 11 GICS sectors simultaneously usually leads to information overload, making it easy to miss the start of a new trend. By utilizing a sector rotation heat map, you can bypass the noise and see exactly where money is moving in real time.
You're likely tired of comparing static tables or waiting for analysts to confirm a shift that's already underway. This article provides a clear framework for reading heat maps: you'll learn to spot leading and lagging sectors in seconds. We'll examine how to integrate these visual tools into a streamlined daily market scanning routine. You'll gain the ability to identify market shifts with analytical rigor, ensuring your timing aligns with current capital dynamics rather than outdated reports. This approach turns raw data into a functional workbench for your trading strategy.
Key Takeaways
- Understand why visual density and spatial arrangement provide more context than standard percentage tables when tracking capital flow.
- Interpret color intensity as a direct measure of momentum to distinguish between leading and lagging sectors instantly.
- Learn to map the four stages of the business cycle to visual sector clusters using a sector rotation heat map.
- Establish a multi-timeframe analysis routine to filter out short-term market noise and confirm sustained trend shifts.
- Use BubbleMarkets visualization tools to streamline daily scanning and identify correlations between sectors and sub-industries.
What is a Sector Rotation Heat Map and Why is it Essential?
A sector rotation heat map is a spatial data visualization tool that organizes the 11 Global Industry Classification Standard (GICS) sectors into a single, color-coded interface. It represents the movement of capital across the market by using color to signify performance and area to represent market capitalization. In the current 2026 environment, characterized by the Federal Reserve raising the target range for the federal funds rate to 3.75% - 4.00% in September, these shifts happen rapidly. Traditional text-heavy tables often fail to convey the magnitude of these moves. A percentage list might show that two sectors are up by 1%, but it hides whether that 1% represents a massive move in mega-cap technology or a minor fluctuation in a smaller sector like Utilities. Heat maps solve choice paralysis by aggregating thousands of data points into a single, scannable view, allowing you to identify where institutional liquidity is congregating.
The Mechanics of Capital Flow
Market sectors often operate in a relative, zero-sum environment where capital is finite. When institutional investors perceive heightened risk, they frequently rotate out of "Risk-On" sectors like Technology and into defensive areas like Consumer Staples or Healthcare. Sector rotation is the strategy of moving assets to take advantage of these cyclical shifts. A heat map provides a clear visual signature of this process: you'll see one cluster of the market "cooling" into deep reds while another "heats up" with vibrant greens. This visual contrast makes it easier to spot when the market is transitioning between economic phases, such as moving from a peak into a contraction. You don't have to guess the trend; you can see the momentum shifting in real time.
Visualizing Market Breadth
Standard price maps only show what happened; a sector rotation heat map shows how it happened. It reveals market breadth, which is the degree to which the total market participates in a move. For instance, if the S&P 500 is up but the heat map shows only a few large Technology bubbles are green, the rally is top-heavy and potentially fragile. Conversely, a broad-based rally shows uniform green across diverse sectors like Industrials and Financials. These visualizers also help identify "hidden" winners; these are specific industries that are outperforming even when their parent sector is lagging. This distinction is vital for operators who need to see beneath the surface of broad index averages to find specific opportunities.
Decoding Heat Map Mechanics: Color Intensity and Spatial Arrangement
Effective technical analysis requires more than scanning price lists. A sector rotation heat map functions as a visual engine, translating raw percentages into spatial relationships. The primary mechanic is color intensity, where the saturation of hue indicates the strength of momentum. Darker shades represent aggressive buying or selling; muted tones suggest a lack of conviction. Spatial arrangement further clarifies these dynamics by clustering related assets. This grouping reveals correlations. When all bubbles in a specific sector expand in deep green, it indicates a broad industry move rather than an isolated stock rally.
Standard grids often hide the weight of specific market leaders. By contrast, bubble maps scale the diameter of each asset to its market capitalization. This prevents large-cap bias from distorting your view. If you're looking at the 12.72% YTD gain of the S&P 500 as of August 31, 2026, the map shows whether that gain is distributed or concentrated in a few mega-caps. Adjusting temporal parameters is essential. A 1-day sector rotation heat map captures immediate volatility, while a 1-month view reveals structural shifts in capital flow.
Interpreting Color Velocity
Deep red doesn't always signal a permanent exit. In a rotation context, it often represents a cooling phase where capital moves toward undervalued sectors. You might notice divergence, where half a sector remains green while the other half turns red. This identifies a split in industry sentiment. Neutral colors are equally informative. They signal sectors in consolidation where price discovery is currently stalled. You can use BubbleMarkets visualization tools to scan these color shifts across multiple timeframes simultaneously.
The Power of Bubble Visualization
Bubble maps provide a clearer perspective on market concentration. As of July 20, 2026, semiconductor stocks accounted for approximately 42% of the S&P 500 technology sector and about 20% of the full index. A bubble map makes this concentration immediately visible, preventing you from misinterpreting a tech rally that is actually just a semiconductor move. Scanning for outlier bubbles in a sea of red can reveal stocks showing relative strength during a market downturn. Interactive elements allow you to hover over these outliers for real-time price data and AI market summaries, providing immediate context for the visual data.
Analyzing the Business Cycle Through Sector Performance Maps
Visualizing the business cycle requires recognizing how sector clusters react to specific economic shifts. During early recovery, low interest rates typically fuel Financials and Consumer Discretionary. You'll see these clusters expand on a sector rotation heat map before the broader index fully recovers. In late expansion, demand for physical goods peaks; this is when Energy and Materials often dominate the visual field. As the cycle moves toward a recessionary phase, capital migrates to non-cyclical safe havens. Healthcare and Utilities will often hold their color intensity while cyclical sectors fade, providing a clear visual signal of defensive positioning.
Identifying Leading vs. Lagging Sectors
Heat maps allow you to identify first movers by highlighting sectors that break out ahead of the general market. You can visualize relative strength by observing which bubbles stay green during a broad market pullback. The 2026 market environment provides a clear example: leadership shifted from mega-cap technology to "real economy" sectors like Industrials and Energy. This broadening of leadership included small caps and healthcare, which showed a significant turnaround in late 2025 and 2026. Spotting this shift visually allows you to adjust your exposure before the trend becomes common knowledge in text-based news.
Macro Triggers and Visual Indicators
Macro triggers like interest rate changes are immediately visible on a bond market heat map. When the FOMC raised the target range to 3.75% - 4.00% in September 2026, the visual impact on yield-sensitive sectors was instantaneous. You can correlate these moves with commodities maps to see how rising oil prices influence Energy equity performance. To confirm the "why" behind these shifts, AI market summaries provide immediate context, explaining factors like the AI data center buildout or cost-conscious consumer spending. This multi-asset view ensures you aren't analyzing sectors in a vacuum.
Step-by-Step: How to Spot a Rotation in Progress
Identifying a shift in capital flow requires a systematic approach. Start by setting your time horizon. A 1-day sector rotation heat map captures immediate sentiment, but monthly views reveal structural trends. Compare these timeframes to distinguish between temporary volatility and a genuine cycle shift. If the short-term map is green while the long-term map remains red, you're likely seeing a relief rally rather than a full rotation.
Filter by sector and sub-industry to eliminate irrelevant noise. If the broad market is flat, look for specific clusters like Semiconductors, which comprised 20 percent of the S&P 500 in mid-2026. Compare the top-down sector performance with a bottom-up view of individual stocks. This ensures the move is supported by multiple companies rather than a single outlier. Locate the pivot point; this is the stage where a lagging sector stops declining and begins to turn neutral or light green. Verify this shift using AI-driven market context to see if fundamental news supports the visual change.
Setting Up Your Daily Scan
Efficiency is the priority for any practical operator. Optimize your layout for a 5-minute morning scan by focusing on the top 10 percent of market movers. Use screeners to isolate these stocks instantly. Save custom views for specific macro themes, such as the AI data center buildout, to track related industries across Energy and Tech simultaneously. You can access these screening tools to build a dependable market workbench that fits your routine.
Spotting the Reversal
Visual signals often precede official trend confirmations. Watch for exhaustion signals, where deep green bubbles begin to fade into paler hues. This suggests buying momentum is slowing down. Track the laggard-to-leader transition by monitoring sectors that have been consistently red for weeks. It's important to set price alerts to trigger when a sector bubble crosses a specific visual threshold. This ensures you don't miss the initial stage of a new cycle. By using a sector rotation heat map, you can spot these reversals as they happen, rather than waiting for lagging news reports to confirm the move.
Optimizing Your Workflow with BubbleMarkets Visualization Tools
BubbleMarkets functions as a utilitarian workbench for visual market scanning. It consolidates complex data into a single sector rotation heat map, allowing you to navigate between global stock maps, Crypto Bubble Maps, and Bond Market Bubble Maps within a single interface. This multi-asset integration is essential for observing cross-market correlations. You can simultaneously monitor how rising yields on the Bond Market Bubble Map affect the color intensity of the Real Estate sector on the World Indices Bubble Map. It simplifies scanning.
Unlocking deeper insights requires moving beyond basic grids. Pro, Professional, and Enterprise Subscriptions provide advanced visualization features like extended screening and custom portfolio tracking. When a sudden visual shift occurs, AI Market Summaries provide the necessary context to interpret the movement. If the S&P 500 technology sector bubbles suddenly contract, the AI summary clarifies whether this is due to a specific earnings miss or a broader macro shift, such as the 25 basis point rate hike seen in September 2026. This prevents misinterpretation of visual data.
Advanced Mapping for Professional Traders
Professional operators need more than real-time data; they need historical perspective. The interface allows for custom portfolio tracking, where your specific holdings are visualized as bubbles alongside the broader market. This reveals how your personal exposure correlates with current sector rotations. For those building proprietary models, the Developer API Access provides the raw data needed to integrate these visualizers into existing systems. Historical playback features help you learn from past cycles, such as the 2026 rotation from tech into value, by observing the visual sequence of the shift.
Getting Started with Visual Analysis
The transition from text-heavy news to visual analysis starts with choosing the right toolset. While the Free Live Market Bubble Maps provide immediate utility, the Pro experience offers extended screening and price alerts to streamline your daily routine. Setting up your first custom market bubble map involves selecting your asset class, defining your time horizon, and applying sector filters. You can explore live sector heat maps on BubbleMarkets to begin identifying capital flows with greater spatial clarity. This systematic approach reduces the friction of daily scanning and ensures you aren't missing the start of the next market trend.
Advancing Your Visual Market Analysis
Transitioning from static data to dynamic visualization is the most efficient way to track institutional capital. By using a sector rotation heat map, you can observe the spatial relationship between sector size and performance without the friction of text-heavy reports. You've learned how to decode color intensity as momentum and how to map these shifts to the broader business cycle. This systematic approach ensures your timing is based on objective visual evidence rather than speculative news. You aren't just reading numbers; you're navigating the actual structure of the market.
Maintaining a streamlined scanning routine requires a dependable utility. BubbleMarkets offers interactive multi-asset bubble maps with real-time global asset coverage across stocks, crypto, and bonds. AI-generated market context helps you interpret sudden shifts immediately; this provides a practical workbench for your daily operations. You can Visualize the Market in Real-Time with BubbleMarkets Pro to gain complete transparency into current market dynamics. Start refining your trend analysis with tools designed for analytical clarity today.
Frequently Asked Questions
What is the best timeframe for a sector rotation heat map?
Use multiple timeframes to confirm trends rather than relying on a single view. A 1-day sector rotation heat map captures immediate volatility, while a 1-month or 1-year map reveals structural cycle shifts. For active scanning, a 1-week view often provides the best balance between noise reduction and current momentum. This multi-timeframe approach prevents you from misinterpreting a brief relief rally as a permanent rotation in the broader business cycle.
Can a heat map help me identify individual stocks to buy?
A heat map functions as a top-down screening tool rather than a direct trade signal generator. It identifies specific stocks showing relative strength within their sector clusters. By zooming into a bubble map, you can locate individual outliers that remain green while their parent sector is red. This visual data should be paired with fundamental research; the platform operates strictly for visualization and does not provide personalized investment recommendations.
How often do market sectors typically rotate?
Sector rotation occurs continuously, but major structural shifts typically align with the four stages of the business cycle. These transitions can last from several months to a few years. In the 2026 market environment, leadership shifted from technology mega-caps toward industrials and energy over several months. You can monitor these gradual flows by tracking color intensity changes on a weekly basis, which reveals the transition from "Risk-On" to defensive positioning.
Is a bubble map better than a traditional heat map grid?
Bubble maps offer a clearer view of market concentration by scaling the diameter of each asset to its market capitalization. Traditional heat map grids often use uniform squares, which hides the visual weight of dominant companies like those in the semiconductor industry. A bubble map prevents large-cap bias from distorting your analysis. This spatial arrangement allows you to see if a sector's performance is driven by a few massive entities or broad industry participation.
Do I need a Pro subscription to see real-time rotation?
You can access Free Live Market Bubble Maps for immediate visual scanning across global assets. However, Pro, Professional, and Enterprise Subscriptions unlock advanced functionality required for deeper analysis. These tiered plans include features like extended screening, real-time price alerts, and custom portfolio tracking. Premium tiers are designed for operators who need a more robust utilitarian workbench, including deeper data coverage and historical rotation playback to study past market cycles.
How does AI market summary help in sector analysis?
AI Market Summaries provide immediate context for sudden visual shifts, explaining the fundamental drivers behind the data. If a sector rotation heat map shows a rapid cooling in Financials, the AI summary might correlate this to the September 2026 Fed rate hike. This feature saves time by aggregating news into actionable insights. It helps you understand the "why" behind the visual flow without requiring you to scan multiple text-heavy news outlets manually.
Can I track crypto sector rotation on BubbleMarkets?
You can track digital asset flows using the dedicated Crypto Bubble Map on the BubbleMarkets platform. This tool visualizes capital movement between different coins and tokens, similar to how equity maps track GICS sectors. It allows you to identify which areas of the crypto market are leading or lagging in real time. Integrating these maps with ETF and bond visualizers provides a unified view of global liquidity across various asset classes.
Frequently asked questions
What is the best timeframe for a sector rotation heat map?
Use multiple timeframes to confirm trends rather than relying on a single view. A 1-day sector rotation heat map captures immediate volatility, while a 1-month or 1-year map reveals structural cycle shifts. For active scanning, a 1-week view often provides the best balance between noise reduction and current momentum. This multi-timeframe approach prevents you from misinterpreting a brief relief rally as a permanent rotation in the broader business cycle.
Can a heat map help me identify individual stocks to buy?
A heat map functions as a top-down screening tool rather than a direct trade signal generator. It identifies specific stocks showing relative strength within their sector clusters. By zooming into a bubble map, you can locate individual outliers that remain green while their parent sector is red. This visual data should be paired with fundamental research; the platform operates strictly for visualization and does not provide personalized investment recommendations.
How often do market sectors typically rotate?
Sector rotation occurs continuously, but major structural shifts typically align with the four stages of the business cycle. These transitions can last from several months to a few years. In the 2026 market environment, leadership shifted from technology mega-caps toward industrials and energy over several months. You can monitor these gradual flows by tracking color intensity changes on a weekly basis, which reveals the transition from "Risk-On" to defensive positioning.
Is a bubble map better than a traditional heat map grid?
Bubble maps offer a clearer view of market concentration by scaling the diameter of each asset to its market capitalization. Traditional heat map grids often use uniform squares, which hides the visual weight of dominant companies like those in the semiconductor industry. A bubble map prevents large-cap bias from distorting your analysis. This spatial arrangement allows you to see if a sector's performance is driven by a few massive entities or broad industry participation.
Do I need a Pro subscription to see real-time rotation?
You can access Free Live Market Bubble Maps for immediate visual scanning across global assets. However, Pro, Professional, and Enterprise Subscriptions unlock advanced functionality required for deeper analysis. These tiered plans include features like extended screening, real-time price alerts, and custom portfolio tracking. Premium tiers are designed for operators who need a more robust utilitarian workbench, including deeper data coverage and historical rotation playback to study past market cycles.
How does AI market summary help in sector analysis?
AI Market Summaries provide immediate context for sudden visual shifts, explaining the fundamental drivers behind the data. If a sector rotation heat map shows a rapid cooling in Financials, the AI summary might correlate this to the September 2026 Fed rate hike. This feature saves time by aggregating news into actionable insights. It helps you understand the "why" behind the visual flow without requiring you to scan multiple text-heavy news outlets manually.
Can I track crypto sector rotation on BubbleMarkets?
You can track digital asset flows using the dedicated Crypto Bubble Map on the BubbleMarkets platform. This tool visualizes capital movement between different coins and tokens, similar to how equity maps track GICS sectors. It allows you to identify which areas of the crypto market are leading or lagging in real time. Integrating these maps with ETF and bond visualizers provides a unified view of global liquidity across various asset classes.
Market information on this page is for education and general information only. It is not investment advice or a recommendation to buy or sell any asset.