 BubbleMarkets
 Blog
Explainers on reading the markets as bubbles: what a move means, when it is unusual, and how the same picture looks across stocks, ETFs, crypto, forex, commodities, bonds and indices.

Stock Market Screener: How to Filter and Read Stocks More Clearly
Learn how to use a stock market screener to filter thousands of stocks, interpret your results in context, and build an effective stock research workflow.

Commercial Financial Widget Licensing: A B2B Buying Guide
Master commercial financial widget licensing with this B2B guide. Evaluate market data rights, white-label embeds, and API integration options for your team.
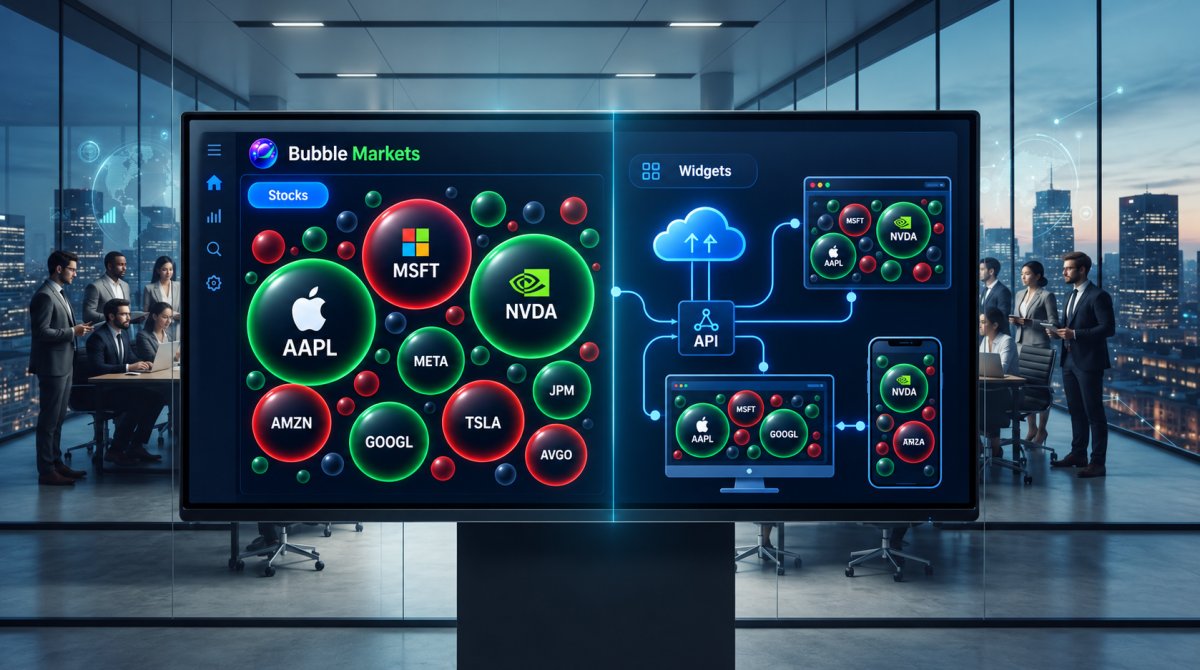
Embeddable Stock Market Widget: JavaScript Libraries and Options
Find the right embeddable stock market widget. Compare hosted widgets, JavaScript libraries, and APIs by setup effort, branding control, and data licensing.
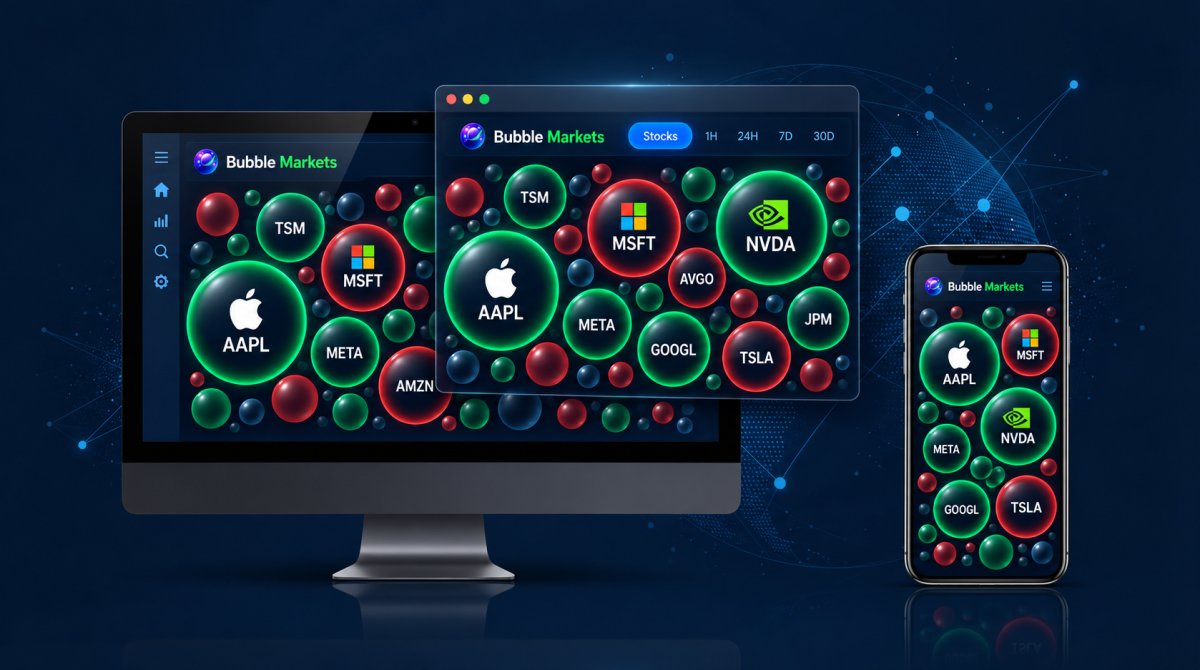
Crypto Heat Map Widget Embed: A Practical Integration Guide
Learn how to choose and add a crypto heat map widget embed to your site. Compare ready-made widgets, APIs, and responsive design practices in this guide.
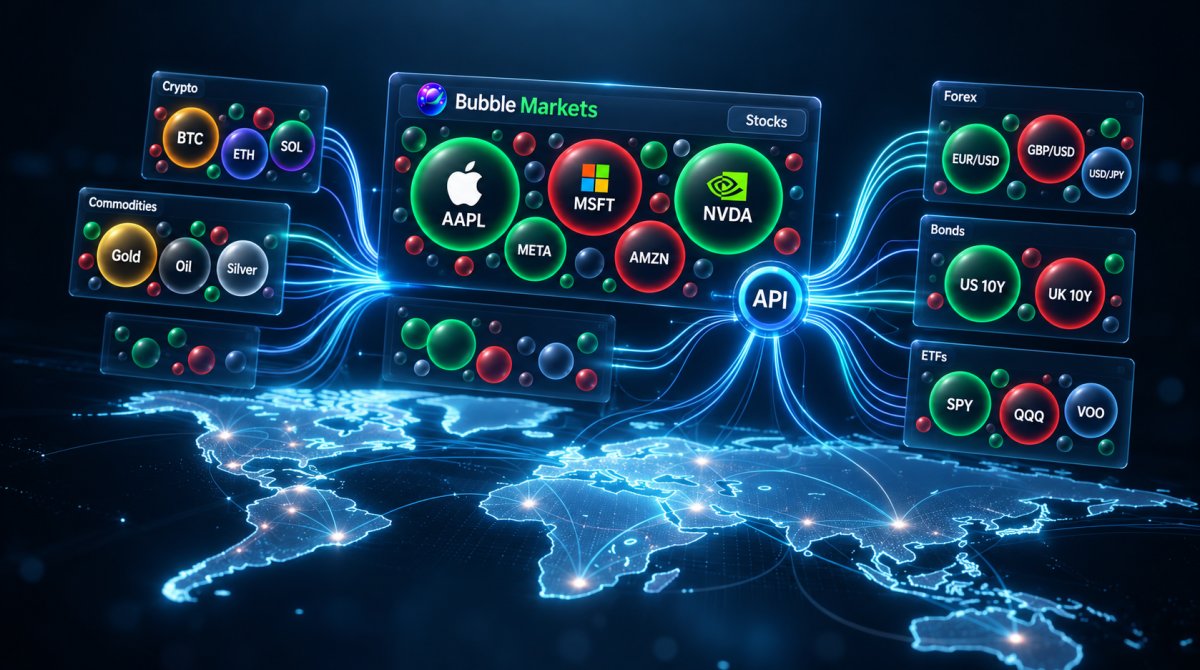
Market Visualizer API: A Practical Guide to Data, Visuals, and Integration in 2026
Learn how to choose and implement a market visualizer api. Evaluate data layers, visual outputs, and coverage to build seamless financial dashboards in 2026.

Financial Data Visualization Software: How to Compare Tools in 2026
Compare financial data visualization software in 2026. Learn how to evaluate BI dashboards, market visualizers, workflows, and APIs to pick the best tool.

AI Market Summary Tool: How to Compare Options in 2026
Looking for the best ai market summary tool? Learn how to compare top options in 2026, verify market data, and build an effective, reliable research routine.

How to Use a Visual Tool to Spot Market Extremes
Discover how to use a visual tool to spot market extremes across stocks and crypto. Compare broad market momentum against isolated asset outliers effectively.

Real-Time Market Alerts Software: How to Compare Tools in 2026
Compare the best real time market alerts software in 2026. Discover how to evaluate data freshness, trigger options, visual heat maps, and workflow tools.
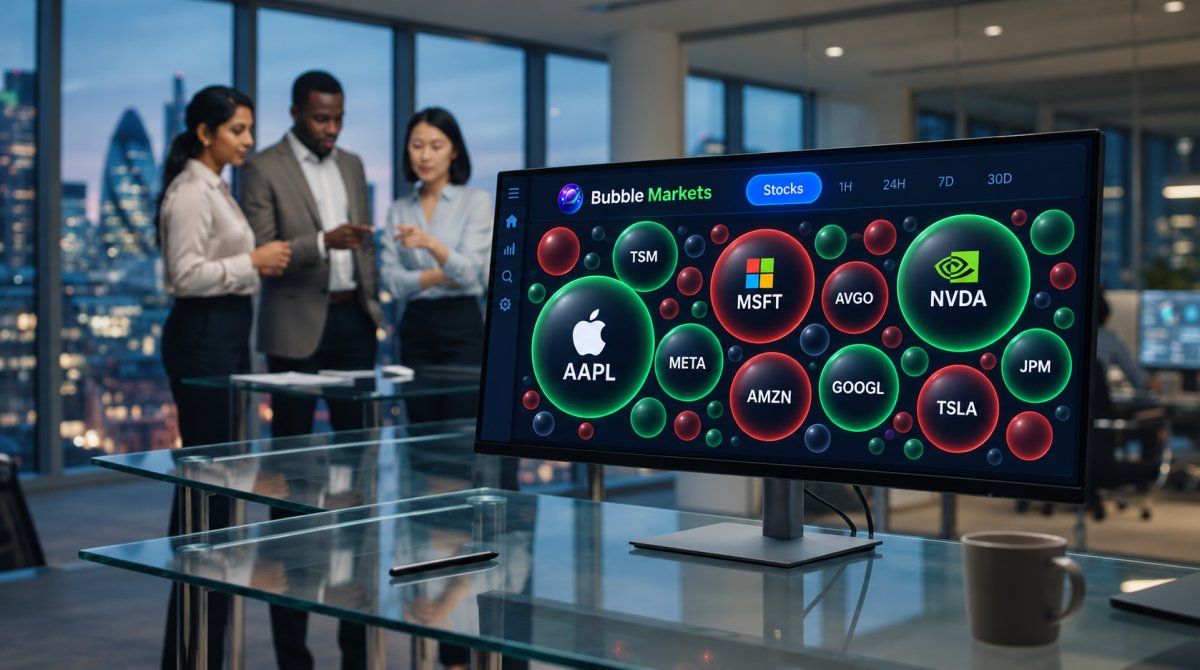
Portfolio Tracking Visualizer: How to See Your Portfolio Clearly
Use a portfolio tracking visualizer to see your asset allocation, track concentration, and spot trends across investments clearly. Read our complete guide now.

Real-Time Crypto Bubble Screener: How to Compare Tools in 2026
Choose the best real time crypto bubble screener in 2026. Compare data freshness, coverage, and visual metrics to scan the crypto market with total confidence.
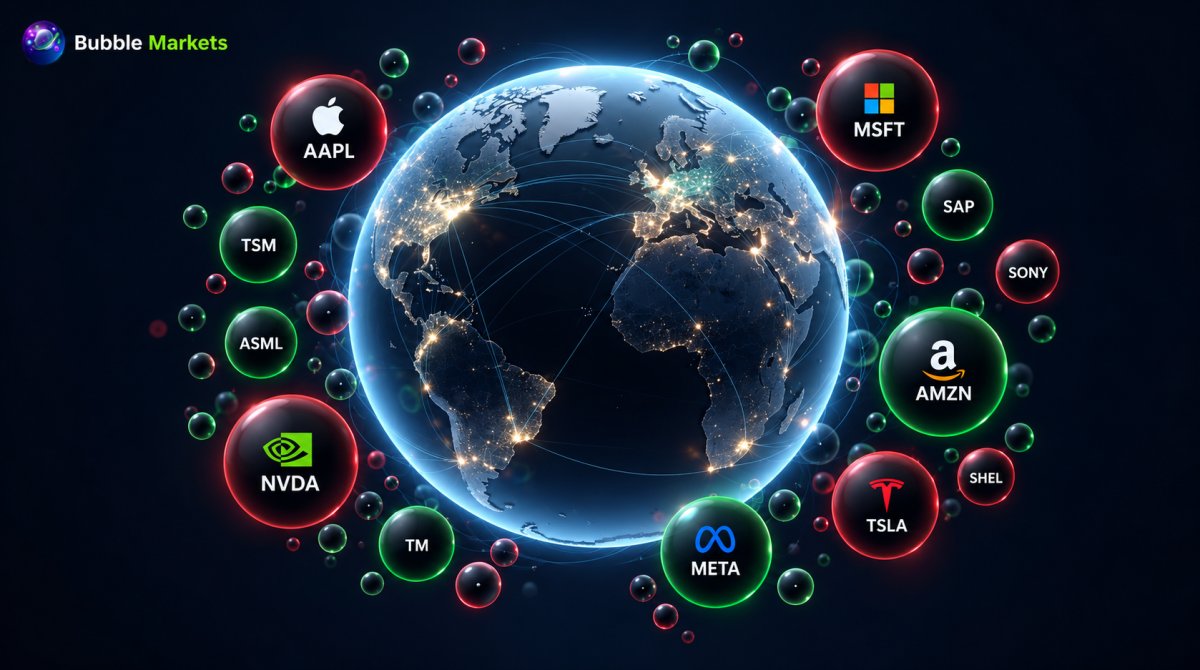
Global Market Sentiment Visualizer: Read Cross-Market Signals
Use a global market sentiment visualizer to track multi-asset trends. Learn how to interpret cross-market data, spot key divergences, and scan live signals.

Visual Stock Tracking Platform: A 2026 Buying Guide
Find the best visual stock tracking platform for your workflow. Compare market heat maps, screening tools, and portfolio trackers in our 2026 buying guide.
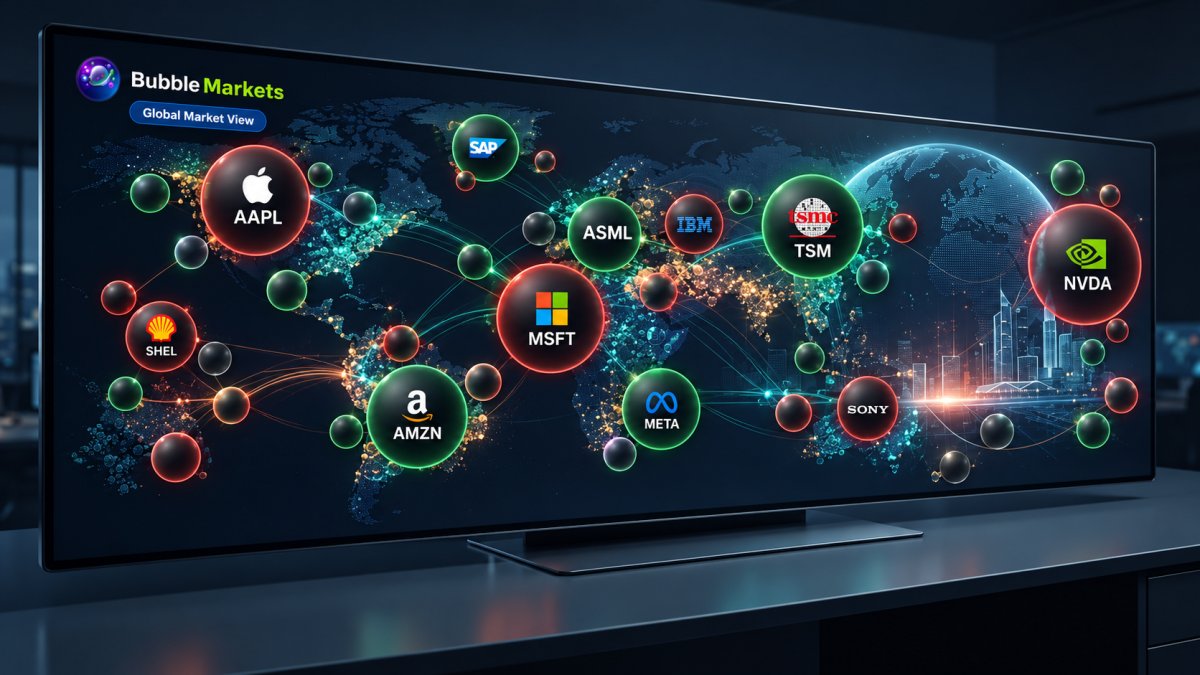
Multi-Asset Market Visualizer: See Global Markets in One View
Discover how a multi asset market visualizer brings stocks, forex, bonds, and crypto into one view. Learn how to scan global market trends systematically.
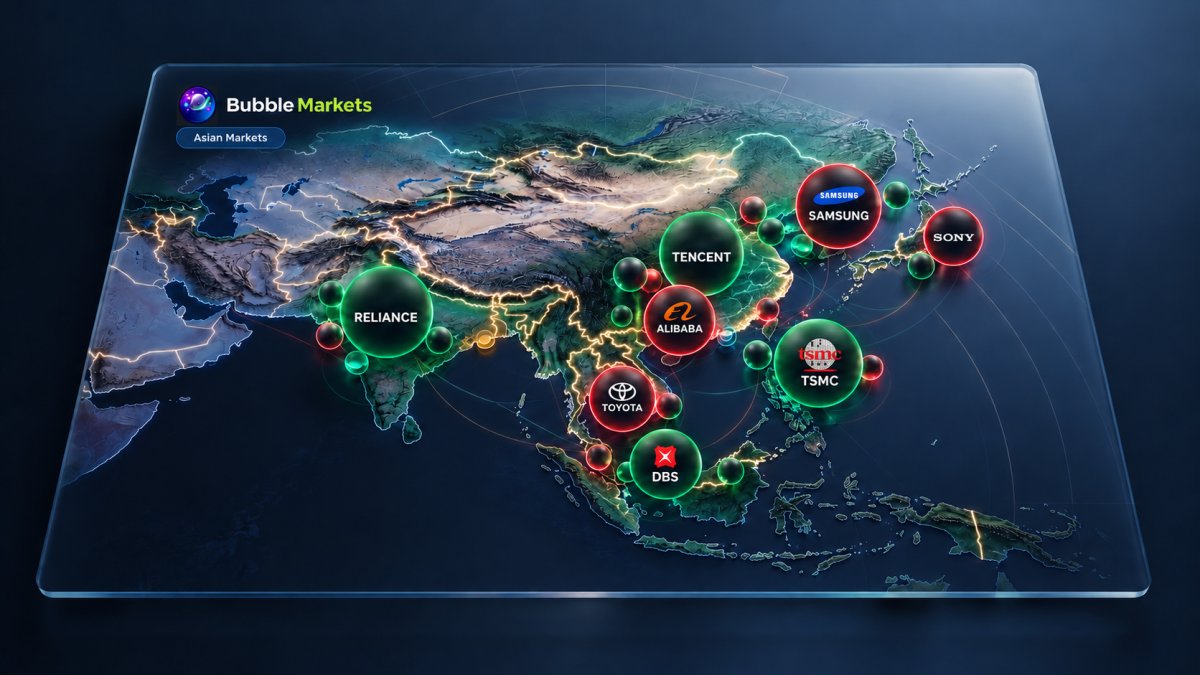
Asian Stock Market Visualizer: How to Scan Regional Equities in 2026
Use an asian stock market visualizer to scan regional equities, spot trends, and read bubble maps with precision. Master your regional market research today.

European Stock Bubble Map: How to Scan Regional Equities in 2026
Learn how to scan regional equities using a European stock bubble map. Track sectors, evaluate market breadth, and interpret visual market data in 2026.

ETF Bubble Map: How to Read Fund Size, Performance, and Exposure in 2026
Learn how to read an ETF bubble map to evaluate fund size, performance, and exposure. Master visual data tools to streamline your fund research in 2026.
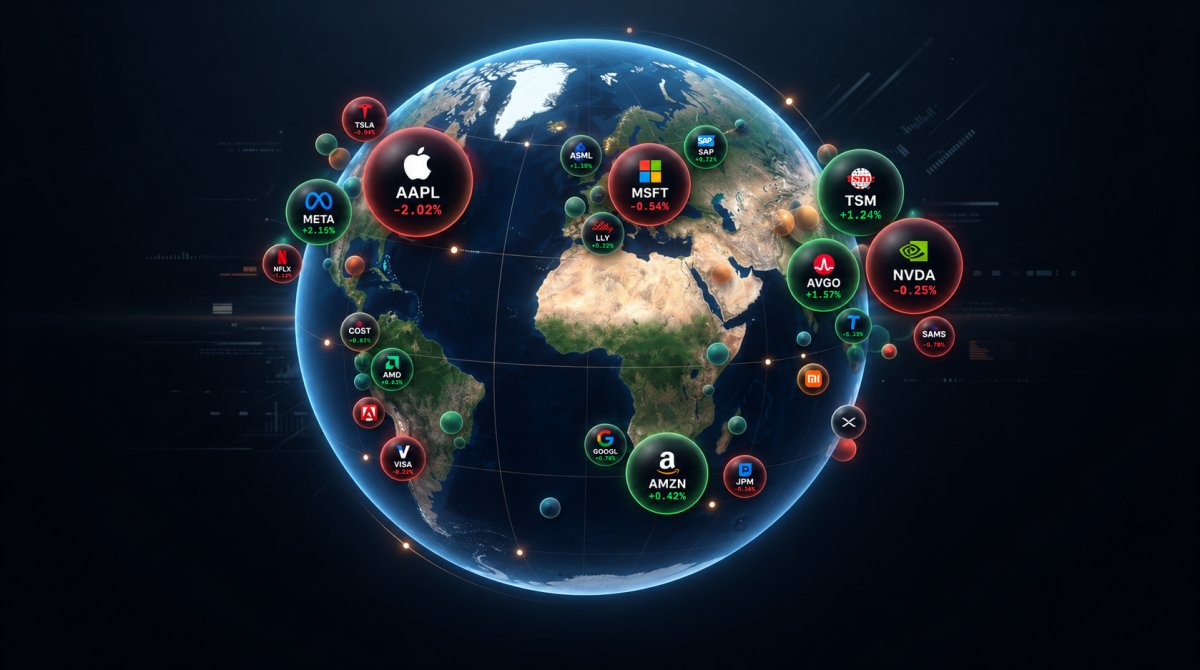
World Indices Bubble Map: How to Scan Global Markets in 2026
Master the world indices bubble map to scan global markets in 2026. Learn how to decode visual metrics, compare regional data, and spot trends accurately.

Visual Market Screener vs FINVIZ: Which Tool Fits Your Research Workflow?
Comparing a visual market screener vs finviz? Discover which tool fits your research workflow, from spotting broad market patterns to running granular filters.

Visual Stock Screener Buying Guide: Compare Tools and Choose the Right Fit
Find the right visual stock screener for your workflow. Compare bubble maps, heat maps, filters, and data coverage to make smarter investment research choices.

Forex Market Bubble Chart: How to Read Currency-Pair Moves
Learn how to read a forex market bubble chart to track currency-pair moves, analyze relative strength accurately, and avoid common visual data mistakes.

Crypto Bubble Map: How to Read Crypto Market Moves in 2026
Learn how to read a crypto bubble map correctly. Discover how to interpret market moves, analyze wallet connections, and spot patterns for smarter research.
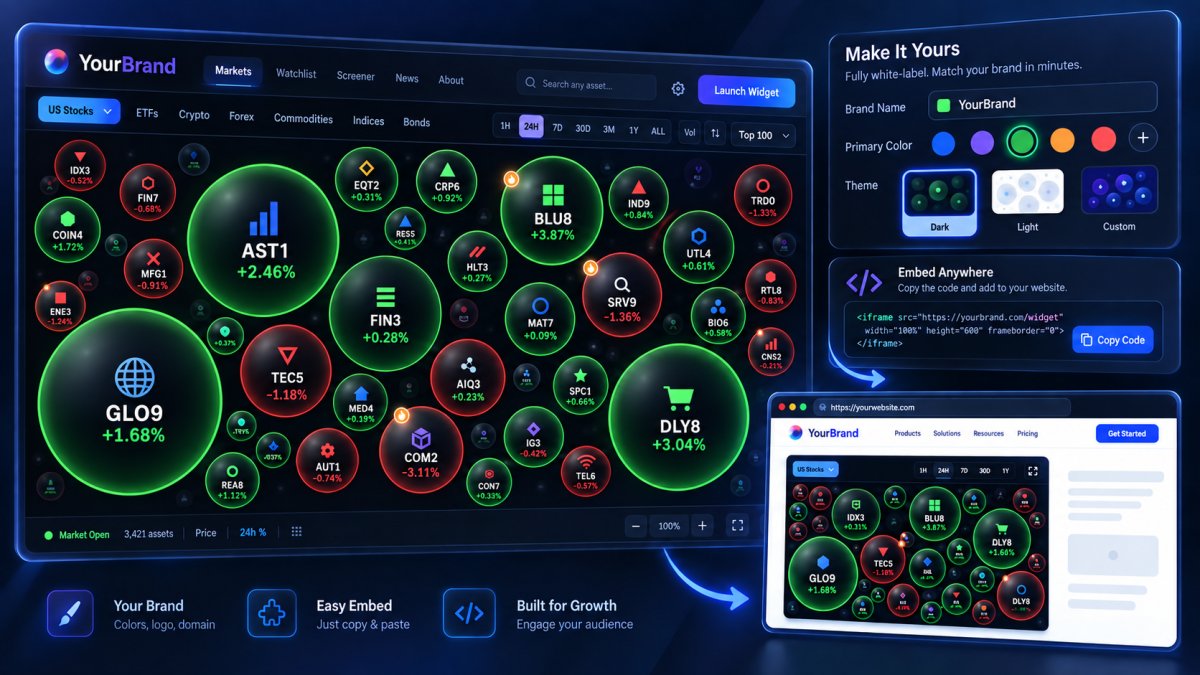
White Label Market Widget: A Buyer’s Guide for 2026
Choose the ideal white label market widget for 2026. Learn how to evaluate licensing rights, compare integrations, and select the right data provider for you.
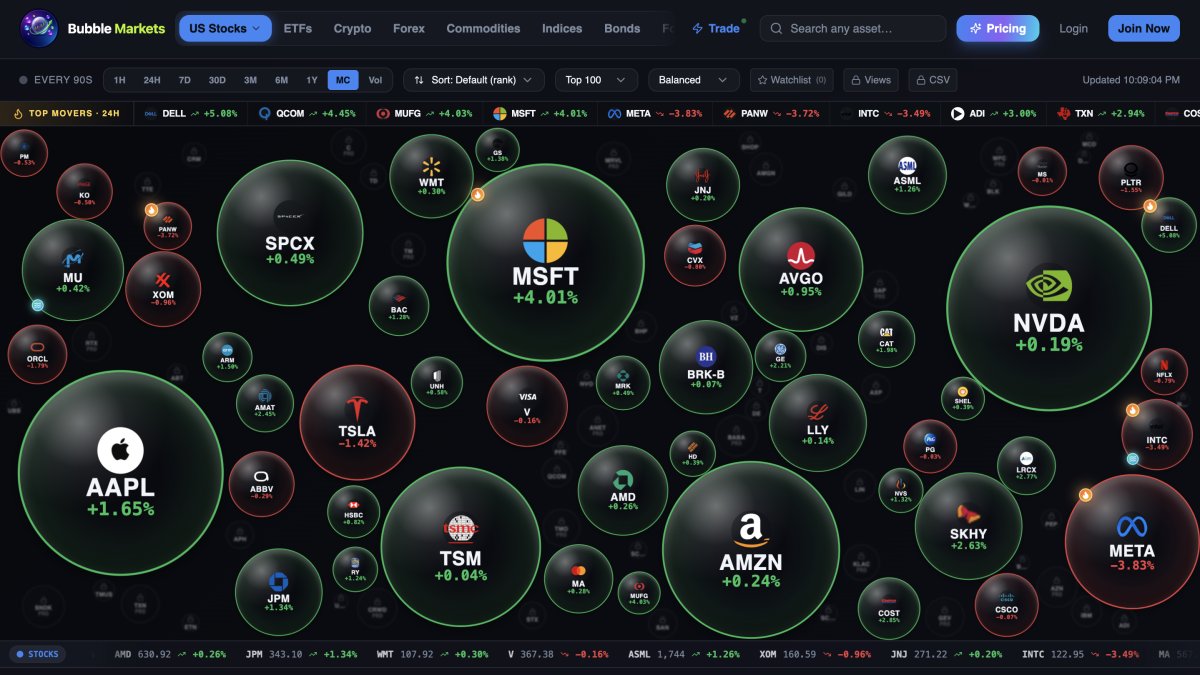
How to Spot Market Trends Visually in 2026: A Practical Workflow
Master how to spot market trends visually 2026 with a practical scan-and-verify workflow using heat maps, sector breadth, and smart charting techniques.

How to Use a Sector Rotation Heat Map to Spot Market Shifts
Master the market with a sector rotation heat map. Learn to track capital flows, identify leading sectors, and spot major trend shifts with clarity and speed.

Stock Market Heat Map: The Visual Guide to Scanning Real-Time Market Trends
Master using a stock market heat map to track real-time trends, spot sector rotation, and analyze market breadth divergences with our practical visual guide.

Interactive Commodities Price Map: Visualizing Global Raw Material Markets
Use an interactive commodities price map to visualize raw material markets, spot sector rotations instantly, and track global market trends without friction.

Market Bubble Map: Complete Guide to Visual Market Scanning in 2026
Master visual market scanning with a market bubble map. Spot capital rotation, volume surges, and macro divergence across cross-asset classes in seconds.