 BubbleMarkets
Interactive Commodities Price Map: Visualizing Global Raw Material Markets

Scanning dense tabular quotes is the slowest way to track macro capital flows. If you monitor global raw materials, you already know the friction: toggling between disjointed contract monitors makes it painfully easy to miss intraday sector rotations and cross-commodity correlations. An interactive commodities price map eliminates this operational drag by converting numerical spreads into immediate, spatial market intelligence. Instead of parsing through disconnected rows of percentage changes, you can assess broader market dynamics at a single glance.
You don't need to cross-reference multiple terminal windows just to see whether capital is flowing into energy contracts or rotating into industrial metals. In this guide, you will learn how an interactive commodities price map transforms dense futures pricing tables into clear visual insights. We'll cover how spatial mapping organizes global energy, metals, and agricultural assets into a unified display, helps you identify market leaders and laggards instantly, and establishes a reliable pre-market visual inspection workflow.
Key Takeaways
- Learn how an interactive commodities price map replaces linear tabular tickers with spatial nodes to instantly highlight relative market performance.
- Understand how multi-dimensional visual cues, including node diameter and color saturation, encode trading volume, price momentum, and volatility in a single view.
- Track cross-market dependencies across energy, metals, and agricultural contracts to detect supply-chain feedback loops before they impact broader markets.
- Implement an efficient pre-market scanning workflow that moves systematically from high-level sector breadth down to individual asset inspection.
- Utilize dedicated visual utilities like the Commodities Bubble Map to eliminate data overload and monitor global raw materials without friction.
Understanding the Interactive Commodities Price Map: Moving Beyond Static Tables
An interactive commodities price map visualizes contracts as dynamic spatial nodes across market sectors. Traditional quote tables obscure relative performance by forcing linear, line-by-line reading across disparate assets. In contrast, spatial visualizers map percentage performance directly to intuitive color hues and node dimensions. Operators gain instant situational awareness of broad market sentiment in a single screen, replacing disjointed rows of numbers with an integrated visual topology.
The Limits of Traditional Futures Quote Boards
Standard market monitors present raw materials as uniform numerical lists. Platforms like TradingEconomics or Barchart arrange contracts in dense alphanumeric tables, which creates distinct analytical bottlenecks:
- Segmented views: Correlated assets sit separated across multiple submenus and disconnected category pages, obscuring broad capital flows.
- Cognitive fatigue: Scanning dozens of tabular percentages line by line slows down evaluation during high-volatility sessions.
- Missing volume context: Static rows treat a minor percentage shift in a low-volume contract identically to massive turnover in benchmark contracts, failing to convey true market weight.
How Spatial Mapping Accelerates Data Comprehension
Human visual processing decodes spatial dimensions, scale, and color contrasts much faster than alphanumeric digits. Within the broader commodity market ecosystem, pricing shifts rarely occur in isolation. Grouping related physical assets into interactive sector clusters exposes cross-asset sympathy moves immediately.
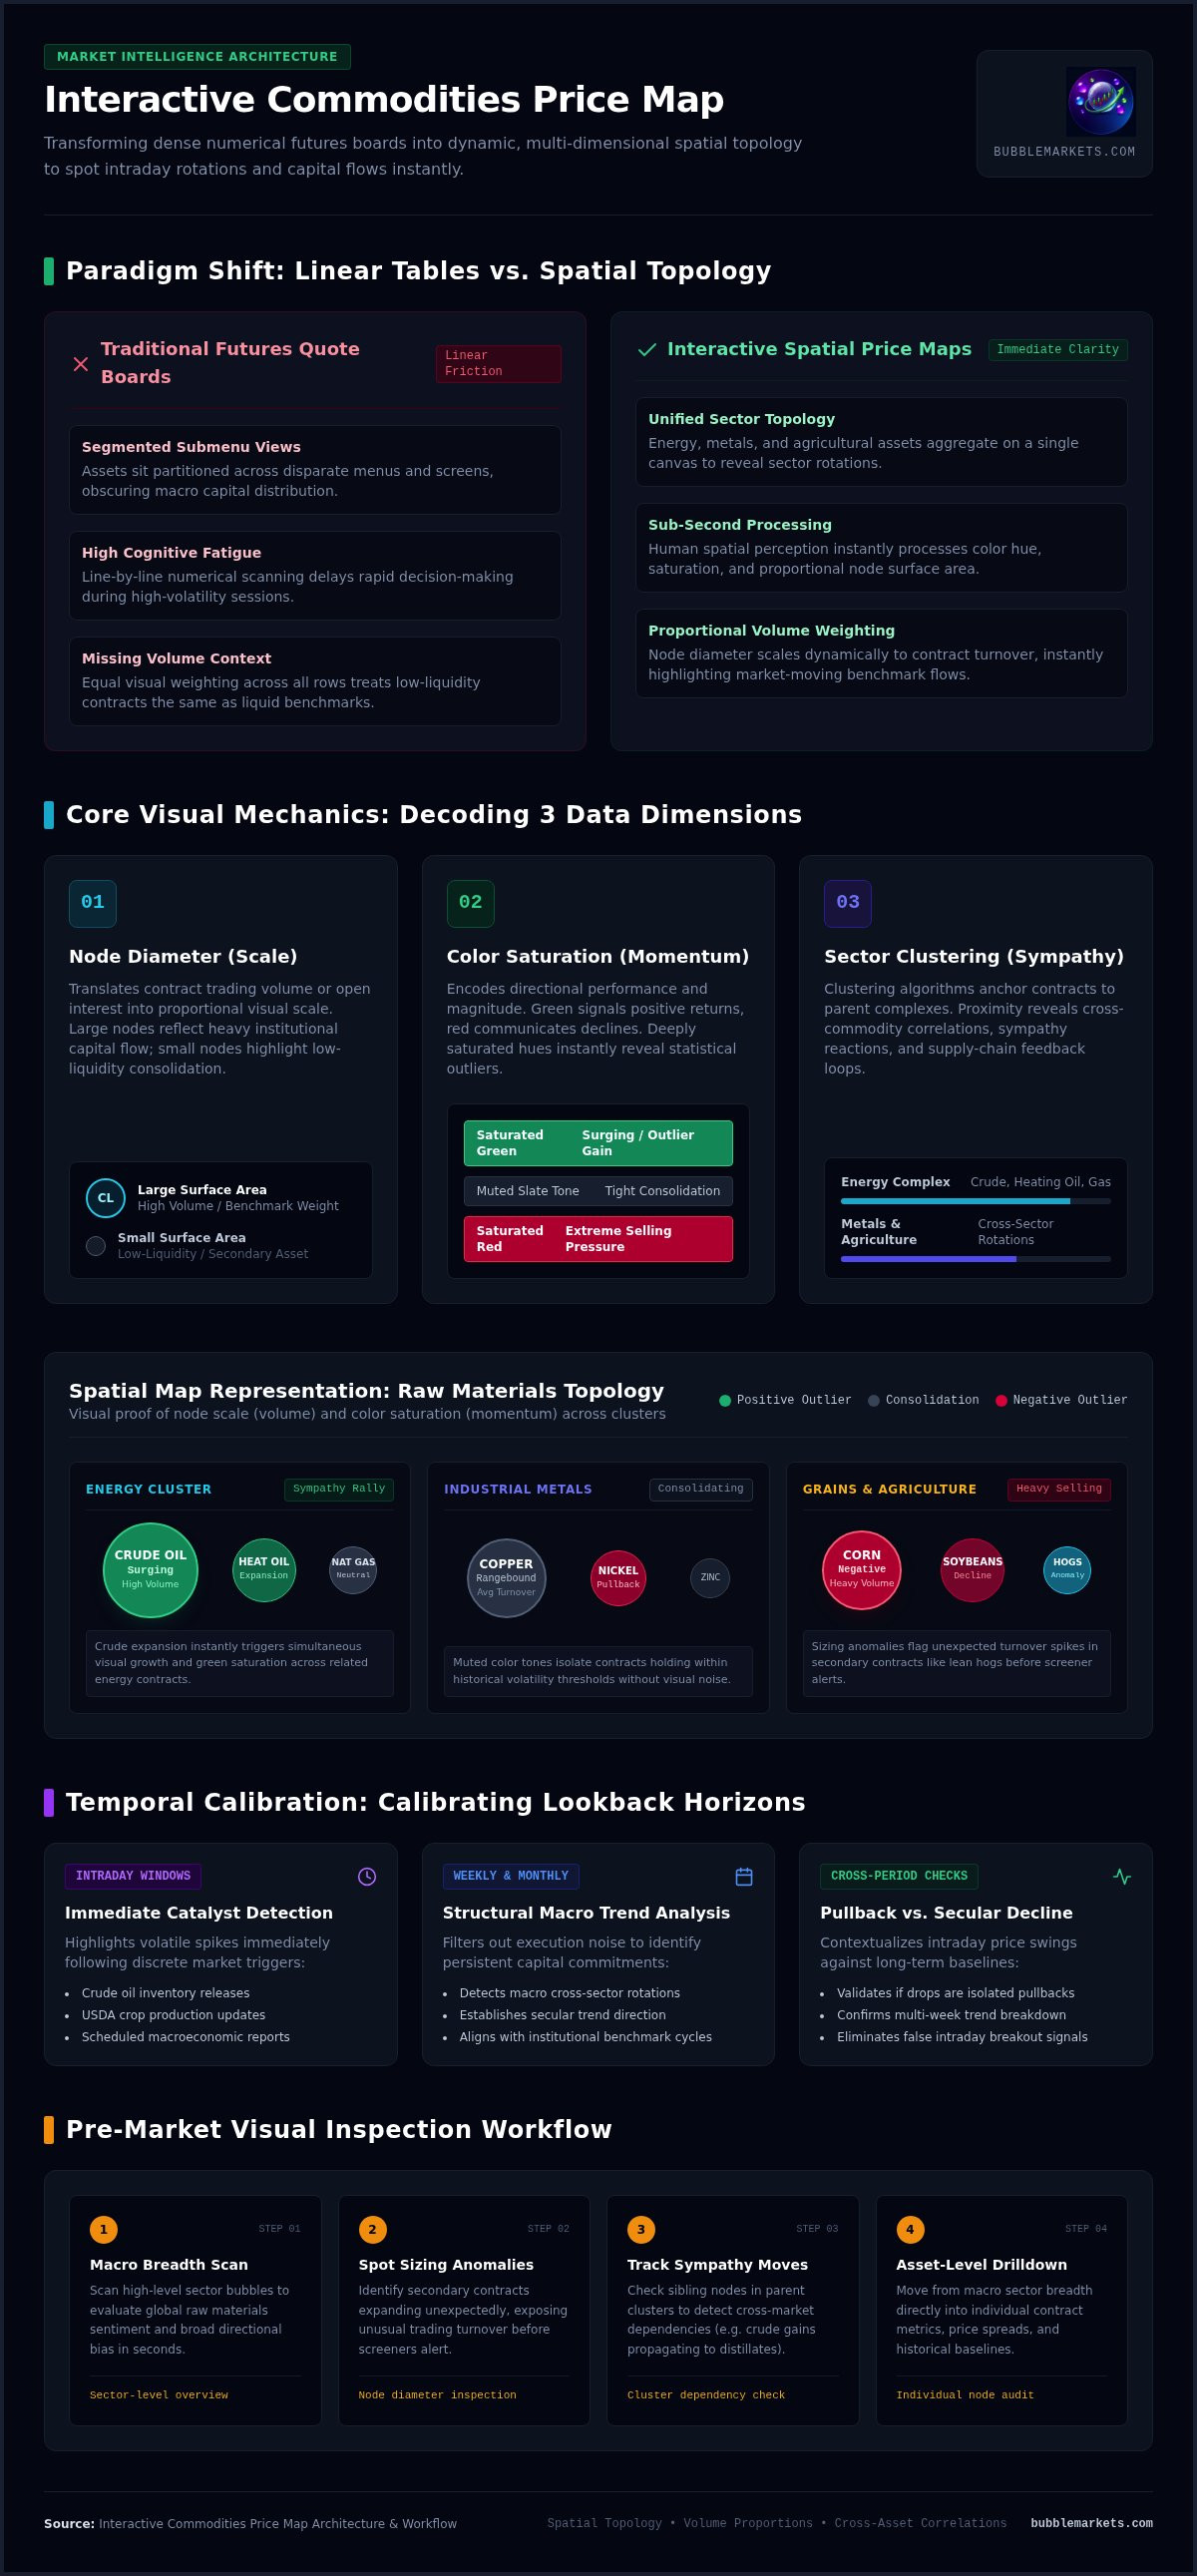
When using an interactive commodities price map, each asset exists as a proportional visual entity. Node sizing can scale to reflect trading volume or open interest, while color saturation communicates price direction and momentum. If crude oil surges, energy contracts expand and shift color simultaneously, allowing you to observe sector breadth instantly rather than calculating percentage changes manually across isolated tickers.
Core Visual Mechanics: Decoding Dimensions, Scale, and Color Dynamics
Modern market maps assign raw market data to distinct visual dimensions: position, size, and color. Clustering algorithms anchor contracts into their parent categories, such as energy, industrial metals, or grains. Within an interactive commodities price map, these parameters combine to establish immediate visual hierarchy across dozens of active markets.
Interpreting Node Sizing and Volume Distribution
Node diameter visually translates trading turnover or open interest into proportional scale. Large bubbles show contracts capturing abnormal capital flow, while small bubbles signal consolidating or low-liquidity assets ignored by broader market participants. Sizing anomalies alert operators to unexpected turnover spikes in secondary contracts, such as heating oil or lean hogs, before those surges appear on standard volume screeners.
Calibrating Temporal Scales and Lookback Windows
Adjusting the operational timeframe transforms how visual clusters represent price action:
- Intraday windows: Highlight immediate volatility spikes following economic releases, crop production updates, or crude oil inventory figures.
- Weekly and monthly views: Filter out transient execution noise to expose macro rotations and structural trend developments.
- Cross-period checks: Help determine whether an intraday plunge is an isolated pullback or part of an ongoing secular decline.
Monitoring these temporal shifts alongside institutional benchmarks, such as the World Bank's Commodity Markets data, gives operators a grounded macroeconomic baseline across long-term cycles.
Color Saturation and Directional Momentum
Standardized color palettes translate directional price changes without requiring alphanumeric calculations. Positive performance displays as green, while negative returns appear as red. Muted tones signify consolidation within historical volatility thresholds. Deeply saturated nodes visually isolate extreme statistical outliers across the raw materials complex.
To inspect these relationships across real-time contracts, exploring a dynamic interface like the BubbleMarkets visualizer offers an immediate, multi-asset perspective on intraday momentum.
Mapping Macro Relationships Across Energy, Metals, and Agriculture
Raw materials do not trade in isolation. Energy inputs, base metals, and agricultural contracts operate through continuous, interdependent feedback loops. Standard multi-tab platforms split these categories into separate screens, obscuring real-time cost transmission. An interactive commodities price map places these sectors onto a single analytical canvas, allowing operators to trace how price shocks propagate across unrelated markets.
Energy Inputs as the Baseline Production Cost Driver
Energy serves as the primary foundational cost across physical supply chains. Movements in crude oil, natural gas, and refined fuels quickly alter downstream margins:
- Smelter and refining operations: Electricity and natural gas spikes force operational curtailments in energy-intensive European zinc and aluminum smelters.
- Agricultural input expenses: Natural gas represents the critical feedstock for nitrogen-based fertilizers like ammonia, directly impacting grain farming overhead.
- Freight and transport: Elevated diesel quotes expand shipping expenses, raising the physical delivery costs of both industrial and soft commodities.
Visualizing energy contracts alongside metals highlights margin compression weeks before corporate financial reports disclose reduced output.
Industrial Metals vs. Precious Metals Divergence
Contrasting industrial metals against precious metals provides immediate insight into prevailing macroeconomic sentiment. Copper and aluminum respond directly to global manufacturing activity, infrastructure spending, and physical supply constraints. Gold and silver, by contrast, act primarily as monetary assets and systemic hedges, reacting to real bond yields and sovereign currency fluctuations.
When industrial nodes expand into saturated red while gold nodes turn green, the interface visually confirms defensive capital rotation. Conversely, expanding copper and aluminum nodes signal risk-on industrial expansion, providing a reliable macro pulse across the broad market.
Agricultural Supply Shocks and Weather Disruption
Grains and soft commodities frequently decouple from broad economic trends due to localized supply events. Severe droughts, regional planting delays, or geopolitical trade barriers restrict grain supplies regardless of consumer demand. In the global commodities marketplace, contracts like Chicago wheat, corn, and soybeans can spike abruptly while industrial sectors stagnate.
An interactive commodities price map cleanly isolates these independent agricultural price spikes from systemic inflation pressures. Comparing grain price surges against diesel costs helps analysts determine whether price increases stem from weather-driven shortages or systemic cost-push pressures.
Daily Market Scanning Workflow: Spotting Volatility and Sector Rotations
Structured visual scanning eliminates subjective guesswork from pre-market preparation. Instead of building complex query filters across multi-column quote sheets, operators can establish a repeatable top-down routine. A well-calibrated interactive commodities price map lets you move from macro sector distribution down to single-contract liquidity verification in under two minutes.
Step 1: Assessing Broad Commodity Market Breadth
Begin each session with an unzoomed macro view of the entire raw materials complex. The primary objective is to evaluate aggregate color distribution across the canvas:
- Systemic versus isolated flow: If energy, industrial metals, and agricultural nodes are uniformly green, broad inflationary buying or currency devaluation is underway.
- Sector decoupling: If energy expands aggressively while metals retreat into deep red, production input costs are creating immediate headwind risks for industrial producers.
- Leading clusters: Observe which sector anchors the highest visual density of positive momentum before standard equity markets open.
Step 2: Isolating Abnormal Performance Outliers
Once you identify overall market breadth, scan for visual anomalies that break standard sector boundaries. Look specifically for nodes displaying disproportionate sizing or saturated coloration relative to their immediate peers.
An oversized node inside a quiet sector marks an asset decoupling on independent catalysts. For example, if copper and nickel remain flat while aluminum displays an expanding, saturated node, check for localized smelter outages or regional supply curbs. Verify whether this momentum is beginning to draw adjacent base metals into sympathetic moves, or whether it remains an isolated supply shock.
Step 3: Validating Moves with Volume and Liquidity
Price velocity without trading liquidity creates false breakout signals. Toggle the visual sizing parameter from percentage change to trade turnover or open interest to validate institutional commitment.
A contract showing large price expansion paired with an enlarged volume bubble indicates genuine accumulation or liquidation. Conversely, a deeply saturated node that remains small under a volume-weighted view indicates an illiquid spike, often caused by erratic overnight fills or thin order books. Dismiss these low-volume outliers to protect your analytical focus.
To run this three-step inspection workflow before every market open, launch the Commodities Bubble Map to track live raw material breadth across global exchanges.
Deploying Real-Time Visual Tools: Streamlining Market Tracking with BubbleMarkets
Modern market analysis requires tools that synthesize high-velocity data without visual friction. Traditional data terminals often lock vital market breadth behind multi-layered spreadsheets and rigid sub-menus. BubbleMarkets delivers a dedicated interactive commodities price map engineered specifically for multi-asset clarity. By serving purely as an objective data visualization platform rather than a brokerage, the interface focuses entirely on transparent, rapid price discovery across physical commodity sectors.
Navigating the Commodities Bubble Map Interface
The Commodities Bubble Map organizes raw materials into an adaptable, interactive workspace. Operators can calibrate the display in seconds to match their analytical focus:
- Flexible lookback intervals: Toggle between hourly, intraday, weekly, and multi-month windows to assess whether current price behavior reflects short-term noise or structural momentum.
- Dynamic metric scaling: Size bubbles by raw percentage change, volume weighting, or historical volatility to instantly surface key market drivers.
- Categorical isolation: Filter energy, industrial metals, precious metals, or agricultural assets with a single click, stripping out visual noise during targeted sector reviews.
This layout lets you examine relative performance across global raw materials without constantly switching browser tabs.
Integrating Advanced Screening and Custom Alerts
Transitioning from high-level visual discovery to detailed asset monitoring requires zero workflow friction. Operators can move directly from broad sector scans to the integrated Market Screener to inspect granular contract metrics and performance history.
For ongoing oversight, pair visual scans with Portfolio Tracking and Price Alerts. Configuring automated alerts on specific commodity contracts flags sudden breakout moves and unusual volume surges as they develop. This eliminates the need to watch static ticker boards throughout the trading day. Explore the BubbleMarkets platform to build a streamlined, visual market tracking workflow tailored to your daily routine.
Upgrading Your Raw Material Market Workflow
Linear quote boards are no longer sufficient for navigating fast-moving raw material dynamics. By deploying an interactive commodities price map, you replace fragmented tables with immediate visual clarity. Dynamic bubble sizing driven by real-time volume and performance exposes sector rotations, liquidity concentrations, and macro divergences before standard quote sheets reflect market breadth.
Mapping energy, metals, and agricultural contracts on a unified canvas clarifies how input costs ripple across physical supply chains. You don't have to manually reconcile dozens of tickers to verify whether price momentum is supported by true institutional participation. Operating purely as an analytical visual utility with zero brokerage conflict of interest, the platform provides an unvarnished view of physical asset flows. Explore the Commodities Bubble Map on BubbleMarkets to integrate spatial inspection into your daily routine and track global commodity markets with total clarity.
Frequently Asked Questions
What is an interactive commodities price map?
An interactive commodities price map is a visual market interface that displays raw material contracts as dynamic spatial nodes. Instead of presenting pricing data in static, tabular rows, it maps performance, trading volume, and volatility metrics directly to bubble dimensions and color saturation. This structure allows operators to evaluate broad raw material sentiment and sector breadth across energy, metals, and agriculture on a single unified screen.
How does bubble size correlate with commodity market data?
Bubble size typically reflects user-selected weighting metrics, such as trading volume, open interest, or the absolute magnitude of price percentage movement. Larger bubbles signify contracts capturing significant market participation or displaying abnormal price expansion. Smaller bubbles indicate baseline consolidation or muted liquidity. This visual scaling helps operators instantly distinguish between high-conviction institutional moves and quiet, low-activity contracts without parsing numerical volume columns.
Can an interactive price map track physical commodity contracts and futures?
Yes, visual commodity maps track continuous futures contracts representing both deliverable physical commodities and cash-settled benchmarks across global exchanges. The interface visualizes price action for energy assets like Brent crude and natural gas, industrial and precious metals, and agricultural crops. It aggregates these derivatives feeds into visual nodes strictly for price discovery and market monitoring, operating without trade execution or brokerage features.
How do visual commodity maps differ from traditional market heatmaps?
Traditional heatmaps rely on rigid, rectangular grids where tile sizes are often fixed or tied strictly to static market capitalization tiers. An interactive commodities price map uses free-floating, proportional nodes that dynamically rearrange based on active market metrics. This fluid layout highlights sudden volume anomalies and sector momentum more effectively, preventing small-cap or secondary contracts from being obscured by massive energy benchmarks.
Why is visual sector clustering important for commodity traders?
Visual sector clustering groups related assets into shared categorical zones, exposing cross-commodity correlation and cost transmission instantly. Because raw materials operate through interconnected supply chains, sharp moves in energy inputs directly affect refining margins and agricultural fertilizer expenses. Grouping contracts visually enables operators to detect whether price action represents broad sector rotation, systemic inflation hedging, or an isolated, asset-specific supply disruption.
Can I customize the lookback timeframe on a commodities bubble map?
Yes, users can adjust lookback parameters across intraday, daily, weekly, and monthly intervals. Calibrating these temporal settings helps operators isolate immediate volatility spikes following inventory reports or economic releases from longer-term structural trends. Shifting between lookback frames clarifies whether a sharp price drop represents a temporary counter-trend pullback or the beginning of a broader cyclical decline across the raw material complex.
Frequently asked questions
What is an interactive commodities price map?
An interactive commodities price map is a visual market interface that displays raw material contracts as dynamic spatial nodes. Instead of presenting pricing data in static, tabular rows, it maps performance, trading volume, and volatility metrics directly to bubble dimensions and color saturation. This structure allows operators to evaluate broad raw material sentiment and sector breadth across energy, metals, and agriculture on a single unified screen.
How does bubble size correlate with commodity market data?
Bubble size typically reflects user-selected weighting metrics, such as trading volume, open interest, or the absolute magnitude of price percentage movement. Larger bubbles signify contracts capturing significant market participation or displaying abnormal price expansion. Smaller bubbles indicate baseline consolidation or muted liquidity. This visual scaling helps operators instantly distinguish between high-conviction institutional moves and quiet, low-activity contracts without parsing numerical volume columns.
Can an interactive price map track physical commodity contracts and futures?
Yes, visual commodity maps track continuous futures contracts representing both deliverable physical commodities and cash-settled benchmarks across global exchanges. The interface visualizes price action for energy assets like Brent crude and natural gas, industrial and precious metals, and agricultural crops. It aggregates these derivatives feeds into visual nodes strictly for price discovery and market monitoring, operating without trade execution or brokerage features.
How do visual commodity maps differ from traditional market heatmaps?
Traditional heatmaps rely on rigid, rectangular grids where tile sizes are often fixed or tied strictly to static market capitalization tiers. An interactive commodities price map uses free-floating, proportional nodes that dynamically rearrange based on active market metrics. This fluid layout highlights sudden volume anomalies and sector momentum more effectively, preventing small-cap or secondary contracts from being obscured by massive energy benchmarks.
Why is visual sector clustering important for commodity traders?
Visual sector clustering groups related assets into shared categorical zones, exposing cross-commodity correlation and cost transmission instantly. Because raw materials operate through interconnected supply chains, sharp moves in energy inputs directly affect refining margins and agricultural fertilizer expenses. Grouping contracts visually enables operators to detect whether price action represents broad sector rotation, systemic inflation hedging, or an isolated, asset-specific supply disruption.
Can I customize the lookback timeframe on a commodities bubble map?
Yes, users can adjust lookback parameters across intraday, daily, weekly, and monthly intervals. Calibrating these temporal settings helps operators isolate immediate volatility spikes following inventory reports or economic releases from longer-term structural trends. Shifting between lookback frames clarifies whether a sharp price drop represents a temporary counter-trend pullback or the beginning of a broader cyclical decline across the raw material complex.
Market information on this page is for education and general information only. It is not investment advice or a recommendation to buy or sell any asset.