 BubbleMarkets
Market Bubble Map: Complete Guide to Visual Market Scanning in 2026

Tabular screeners often obscure the very market dynamics they're built to reveal. Scanning endless rows of tickers across disconnected spreadsheets makes sudden capital rotation nearly impossible to catch in real time. A modern market bubble map solves this operational friction: it converts dense financial data into immediate, multi-dimensional spatial intelligence on a single canvas.
If you've spent pre-market routines toggling between separate monitors for equities, crypto, and commodities, you know how quickly cognitive fatigue sets in. Linear screeners force you to mentally calculate relative performance across isolated tabs, which slows down macro observation and buries developing sector surges under rows of text.
This guide breaks down how to read visual coordinates, from bubble diameter and color saturation to dynamic axis positioning, so you can identify momentum and relative volume shifts across asset classes instantly. We'll explore the core mechanics of cross-asset visualization, examine how visual maps isolate market divergence, and show you how to streamline your daily market scanning in seconds rather than minutes.
Key Takeaways
- A market bubble map translates multi-variable data into spatial coordinates, enabling instant recognition of leaders, laggards, and volume surges.
- Bubble diameter, color saturation, and relative clustering correspond directly to market weight, performance velocity, and sector correlation.
- Unlike rigid tabular screeners or segmented treemaps, dynamic visual maps plot multiple independent metrics simultaneously across two custom axes.
- A structured top-down workflow lets operators isolate macro sector rotations before inspecting individual asset divergence.
- Deploying unified multi-asset visualizers bridges equities, crypto, commodities, and fixed income on a single operational canvas.
What Is a Market Bubble Map and How Does Visual Scanning Work?
A market bubble map represents financial assets as dynamic, floating circular nodes distributed across an interactive canvas. Unlike static spreadsheets that force sequential reading, this interface translates multi-variable statistics into instant spatial cues. Traders can monitor systemic breadth, evaluate capital allocation, and identify outlier volatility without parsing hundreds of tabular entries. While classical technical charts focus on isolated price histories, visual mappers contextualize an asset against its entire peer group in real time.
The term draws an intentional parallel to how market expansions form. While an economic bubble describes unsustainable asset inflation driven by speculative excess, a bubble map visualizes relative valuation, liquidity concentrations, and directional momentum across live market sessions. As intraday liquidity shifts, these visual nodes resize and migrate continuously, reflecting capital inflows and outflows as they happen.
The Mechanics of Multi-Dimensional Data Encoding
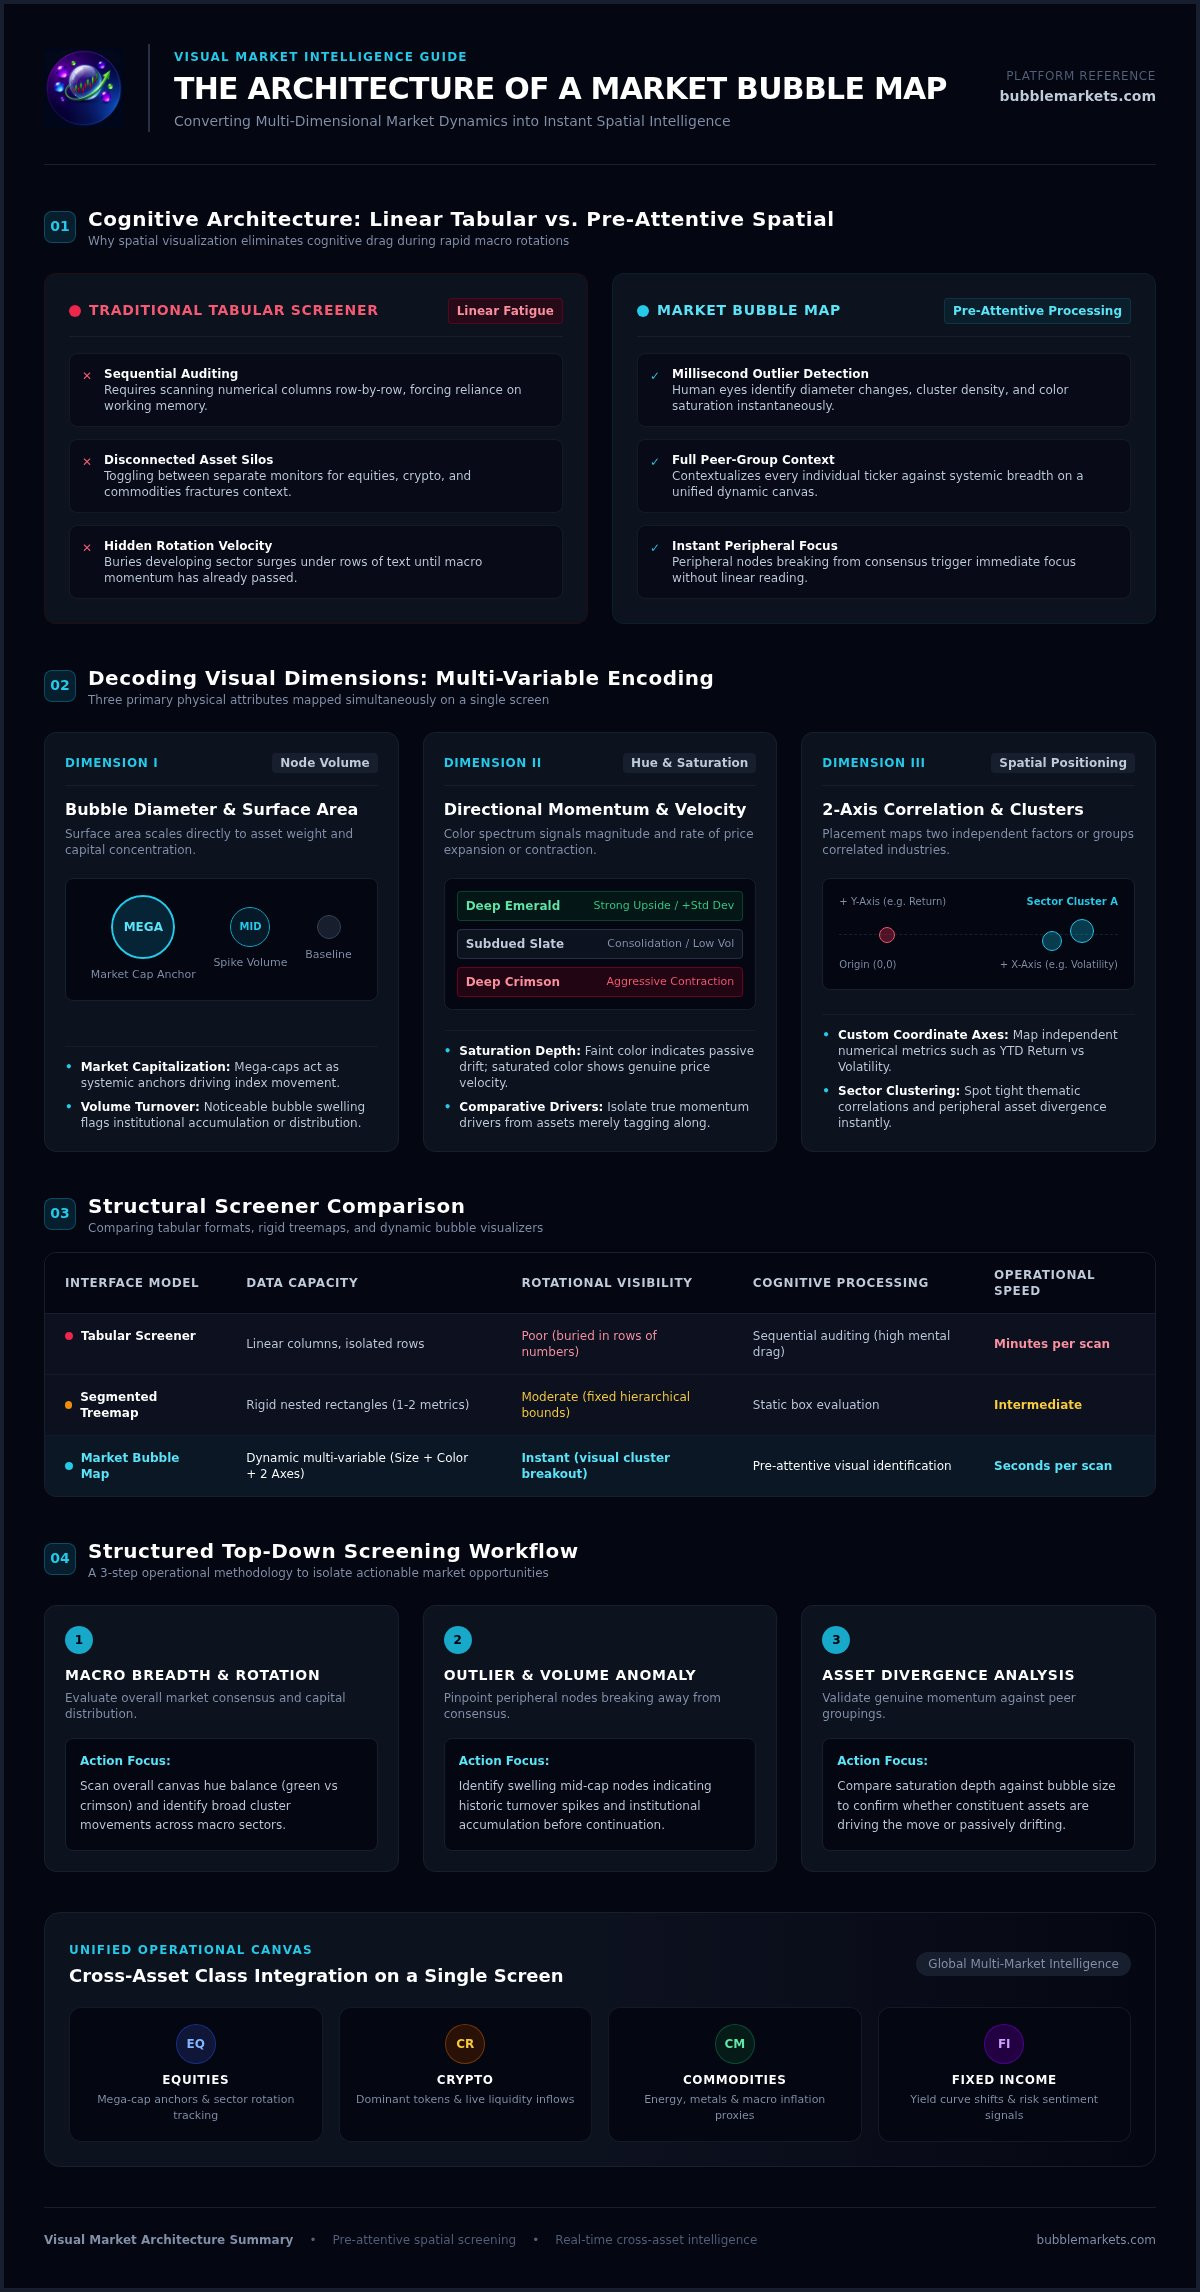
Standard data visualizers rely on three core visual dimensions to encode complex financial information:
- Node volume: Surface area scales directly to asset weight, representing market capitalization, daily turnover, or relative volume metrics.
- Color saturation: Hue signifies directional price change over specified intervals, moving from deep red for sharp drawdowns to saturated green for strong upside velocity.
- Spatial coordinates: The positioning along horizontal and vertical axes maps independent numerical factors, such as year-to-date return versus volatility, or groups related tickers into distinct industry clusters.
Overcoming Tabular Fatigue in Modern Market Analysis
Tabular screeners create cognitive drag. Scanning numerical columns line by line requires linear processing, forcing your brain to store individual values in working memory just to identify relative leaders and laggards. This mechanical reading slows your macro assessment when liquidity moves rapidly between sectors.
Spatial layouts engage pre-attentive visual processing instead. The human eye identifies discrepancies in diameter, cluster density, and color intensity within milliseconds. An extreme mover or a volume anomaly immediately separates from the central mass of assets. Rather than auditing every ticker on a screen, an operator directs their attention straight to the peripheral nodes breaking away from the broader market consensus.
Decoding Visual Dimensions: Interpreting Size, Color, and Clustered Layouts
Interpreting a market bubble map requires systematically breaking down each visual coordinate. When you examine a visual screener, the interface presents multiple data layers at once: node diameter, color depth, and spatial proximity. Knowing how these dimensions interact lets you isolate systemic weighting, momentum velocity, and cross-sector rotations without second-guessing what the screen is showing you.
Evaluating Bubble Size and Volume Weighting
Bubble diameter establishes proportional significance. Sizing typically reflects either total market capitalization or relative volume:
- Market capitalization: Sizing by valuation highlights systemic weighting. Mega-cap tech equities or dominant crypto tokens appear as massive anchors, showing how broader index movements correlate with their individual price action.
- Volume weighting: Sizing by intraday turnover reveals abnormal liquidity. Mid-cap assets experiencing historic volume spikes swell noticeably on screen, flagging institutional accumulation or distribution before directional price continuation occurs.
Reading Color Gradients and Trend Direction
Color communicates directional momentum and performance velocity. Standard interfaces deploy a spectrum from deep green for substantial gains to deep crimson for aggressive contractions. Subdued or slate-toned nodes mark consolidation ranges where volatility is compressing.
Pay close attention to saturation. A faint green node indicates marginal upward drift, while vibrant emerald saturation highlights an asset extending several standard deviations above its baseline. Comparing saturation across similarly sized bubbles reveals which market constituents are genuinely driving a move rather than drifting along with index momentum.
Spatial Placement and Sector Groupings
Positioning provides context. Visual algorithms group related nodes by industry sector, thematic category, or asset class. Proximity signals shared economic drivers, allowing you to gauge sector-wide participation instantly.
When an entire sector cluster displays uniform color and tight grouping, liquidity is moving across the theme as a unified basket. In contrast, an isolated bubble drifting away from its industry cohort marks idiosyncratic divergence: an earnings beat, regulatory catalyst, or company-specific liquidity event. Cross-cluster comparisons reveal capital flowing out of risk-on segments into defensive utilities or sovereign fixed income. To inspect these multi-dimensional dynamics across global equities and digital assets, open a free visual session on BubbleMarkets to evaluate live relative volume and sector clustering directly.
Market Bubble Maps vs. Traditional Screener Tables and Treemaps
Interface architecture dictates analytical speed. While tabular screeners and treemaps remain common across trading desks, each framework serves a fundamentally different cognitive purpose. Tabular screeners organize raw numbers for precise auditing, whereas treemaps present fixed, hierarchical partitions. A dynamic market bubble map discards rigid cell borders entirely, prioritizing immediate pattern discovery across volatile trading sessions.
Understanding these trade-offs ensures you deploy the right visual format for the right operational task:
- Tabular screeners: Optimized for granular valuation audits, filtering specific debt ratios, and reviewing trailing quarterly metrics.
- Treemaps: Ideal for visualizing fixed index weighting within boxed sector tiles, though constrained by static geometric boundaries.
- Bubble maps: Designed for rapid pre-market scanning, tracking fluid capital rotation, and spotting multi-variable outliers across asset classes.
Cognitive Speed: Scanning Time Across Visualization Formats
Reading tabular rows demands focused mental effort. An operator scanning twenty columns of percentage changes must manually rank values row by row, converting text into a mental distribution model. That sequential process breaks down when rapid morning volume hits multiple asset classes at once.
Fluid visual maps bypass that bottleneck through instant pre-attentive recognition. Physics-based circular nodes float and adjust according to live parameters, allowing peripheral vision to register sudden asset expansion or directional drift in fractions of a second. You don't parse decimal points to realize a sector is breaking out; the visual cluster signals the surge automatically.
Data Density vs. Visual Friction
High data density often introduces severe operational friction. Traditional tables crowd the viewport with dozens of metrics, which can easily trigger analysis paralysis during active market hours. Treemaps solve part of this problem by packing tickers into nested rectangular boxes. However, their fixed borders prevent assets from drifting dynamically across axes, masking multi-asset divergence and relative momentum shifts.
An interactive market bubble map balances high-level breadth with on-demand depth. The primary canvas displays macro relationships cleanly through size, color, and positioning. Clicking or hovering over any active node then surfaces underlying fundamental data, recent price ranges, and volume metrics without cluttering the broader view. You maintain clear macro context while inspecting specific micro details only when the setup warrants attention.
How to Screen Global Markets with Bubble Maps: A Practical Workflow
A systematic visual scanning protocol uncovers asymmetric market opportunities while filtering out random intraday noise. Rather than reacting impulsively to isolated price spikes, disciplined operators run a top-down scanning sequence. This ensures macro market conditions, sector momentum, and institutional liquidity align before you commit capital to an individual asset.
Following a structured four-step procedure anchors your analysis in objective data:
Step 1: Establishing Macro Breadth and Benchmark Direction
Begin with global perspective. Open a broad world indices view to evaluate general market risk sentiment across North American, European, and Asian sessions. Observe the largest nodes: are index advances supported by widespread participation, or are three mega-cap tech equities carrying the entire benchmark while mid-caps contract? Cross-reference these equity clusters against sovereign bond yields and foreign exchange currency nodes to confirm whether global liquidity is expanding or contracting.
Step 2: Identifying Sector Outliers and Capital Migration
Next, isolate sector-level divergence. Filter the visualizer to compare primary industry groups against the benchmark index. Look for counter-trend clusters: an industry displaying vibrant green saturation on a day when broad market averages trade flat or negative indicates strong institutional accumulation. Inspect ETF visualizers alongside these industry clusters to confirm that passive and active fund flows support the sector rotation.
Step 3: Isolating High-Volume Relative Strength Leaders
Switch your node sizing from market capitalization to relative daily trading volume. This adjustment surfaces mid-cap and small-cap assets undergoing historic turnover spikes. An expanding bubble in a leading sector marks an asset experiencing genuine institutional interest rather than passive float drift. Cross-reference these volume outliers against verified corporate catalysts, earnings announcements, or macroeconomic headlines.
Step 4: Validating Individual Asset Fundamentals and Structure
Click the outlier bubble to pull up its real-time operational metrics. Examine immediate price structure, key moving averages, and underlying valuation numbers to ensure the setup offers technical stability. This final verification filters out low-liquidity penny stocks or speculative tokens whose visual expansion stems solely from momentary illiquid spikes.
To run this scanning protocol across equities, crypto, and commodities on an interactive dashboard, explore the free live market bubble map visualizers on BubbleMarkets to filter live global data instantly.
Deploying Multi-Asset Bubble Maps into Daily Trading Systems
Modern asset classes trade in tightly coupled feedback loops. A surge in crude oil futures impacts airline margins within hours, while shifts in benchmark sovereign debt yields rapidly reprice growth equities and digital assets. Confining your preparation to a single-market terminal leaves you blind to these cross-asset transmission channels. Integrating a unified market bubble map into your daily routine establishes an efficient macro radar across international markets.
Operating a synchronized multi-asset dashboard provides three core operational advantages:
- Cross-market visibility: Track crypto, equities, commodities, and bonds simultaneously on a single canvas rather than managing four isolated software setups.
- Inter-session continuity: Follow capital flows seamlessly as trading moves from Asian bourses to European exchanges and into the North American cash open.
- Unified interface: Compare percentage returns, relative volume, and market weight across asset classes without reconciling mismatched data feeds.
Synchronizing Stocks, Crypto, and Commodities Tracking
Digital assets and technology equities increasingly respond to the same underlying liquidity pulses. During major economic releases, monitoring a crypto cluster alongside index futures shows where risk tolerance is expanding first. Crypto often reflects liquidity shifts in pre-market hours before traditional equity trading begins.
Commodities provide an early operational check on inflation sensitivity. When energy and agricultural bubbles swell with high positive saturation, industrial and consumer discretionary margins often face near-term headwind. Concurrently tracking foreign exchange nodes exposes currency fluctuations that directly influence multinational corporate revenues.
Streamlining Pre-Market and Intraday Routines
Structured visual habits eliminate wasted screen time. An eight-minute morning scan delivers an objective overview of overnight sessions: assess broad Asian and European equity maps, check energy and currency clusters, and evaluate pre-market US volume distributions. This rapid sequence establishes daily market context without requiring manual formula builds.
During active trading, visual configurations keep you ahead of sudden rotations. Rather than monitoring dozens of individual ticker charts, a persistent visual canvas flags developing intraday anomalies the moment capital begins rotating between sectors. Utilizing dedicated visualizers from BubbleMarkets gives operators free live market bubble maps alongside advanced multi-asset coverage, automated screeners, and customizable alerts to maintain comprehensive cross-market visibility throughout the trading day.
Upgrading Your Daily Market Routine with Spatial Visualizers
Linear tables and static spreadsheets slow your analysis down when markets move fast. Adopting a dynamic market bubble map turns dense, multi-variable financial feeds into an intuitive spatial canvas: bubble diameter highlights systemic weighting, color depth quantifies momentum velocity, and dynamic clustering flags sector rotation as it happens.
Whether you trade equities, track crypto liquidity, or evaluate commodity trends, visual coordinates cut your pre-market screening time to minutes. You don't have to jump across fragmented browser tabs to see how global capital flows connect.
Ready to streamline your market scanning? Explore live market bubble maps on BubbleMarkets to access interactive visualizers across stocks, crypto, ETFs, commodities, bonds, and forex. Configure your custom filters, track live sector breadth, and bring visual clarity to your daily preparation.
Frequently Asked Questions
What is a market bubble map used for in daily financial analysis?
A market bubble map serves as an immediate visual screener to evaluate market breadth, sector rotation, and unusual trading activity. Rather than sorting through tabular rows, operators use spatial nodes to detect which industries attract institutional capital and which lag behind. It provides an efficient macro overview before opening detailed chart analysis.
How do you read the size and color intensity of individual bubbles?
Bubble size reflects weight, scaling by either market capitalization or daily trading volume depending on your selected metric. Color indicates directional performance and velocity over a set timeframe: green signifies positive returns while red marks price contraction. Deep color saturation highlights severe statistical outliers, whereas faint tones indicate mild price drift near baseline.
Are market bubble maps suitable for cryptocurrency and commodity markets?
Yes, visual bubble maps function effectively across digital assets, commodities, forex pairs, and sovereign fixed income. Because the underlying visual engine plots numerical values like percentage return and trading volume, any asset class with quantifiable price and liquidity data maps cleanly into circular nodes. This cross-asset compatibility allows operators to track crypto liquidity surges alongside commodity inflation trends.
What is the main difference between a bubble map and a standard heatmap?
Standard heatmaps arrange data into rigid rectangular treemaps confined by fixed grid structures. A market bubble map uses fluid, circular nodes that can float dynamically or map across two independent numerical axes, such as performance versus volatility. This multi-axis arrangement makes relative performance and volume clustering much faster to spot visually.
Can visual bubble maps replace traditional stock charting software?
Bubble maps do not replace technical charting terminals; they complement them. A visual map functions as a high-level radar to discover emerging setups and sector divergence across thousands of tickers. Once you spot an outlier node, you transition to traditional candlestick charts and order books to execute precise technical analysis.
How often do live market bubble visualizers update during active sessions?
Live visualizers update dynamically throughout the trading day to reflect continuous price shifts and volume accumulations. Real-time data feeds refresh node sizes, saturation levels, and spatial positions as trades clear across exchanges. This low-latency refresh allows intraday operators to observe sector-wide momentum shifts as they develop during active market hours.
Can beginner investors use bubble maps without advanced financial training?
Beginner investors can interpret bubble maps immediately because the interface relies on intuitive visual cues rather than dense financial jargon. Recognizing that larger circles carry more market weight and brighter green nodes lead market performance requires zero technical training. The platform provides immediate visual clarity while offering room for deeper multi-variable filtering as analytical skills advance.
Frequently asked questions
What is a market bubble map used for in daily financial analysis?
A market bubble map serves as an immediate visual screener to evaluate market breadth, sector rotation, and unusual trading activity. Rather than sorting through tabular rows, operators use spatial nodes to detect which industries attract institutional capital and which lag behind. It provides an efficient macro overview before opening detailed chart analysis.
How do you read the size and color intensity of individual bubbles?
Bubble size reflects weight, scaling by either market capitalization or daily trading volume depending on your selected metric. Color indicates directional performance and velocity over a set timeframe: green signifies positive returns while red marks price contraction. Deep color saturation highlights severe statistical outliers, whereas faint tones indicate mild price drift near baseline.
Are market bubble maps suitable for cryptocurrency and commodity markets?
Yes, visual bubble maps function effectively across digital assets, commodities, forex pairs, and sovereign fixed income. Because the underlying visual engine plots numerical values like percentage return and trading volume, any asset class with quantifiable price and liquidity data maps cleanly into circular nodes. This cross-asset compatibility allows operators to track crypto liquidity surges alongside commodity inflation trends.
What is the main difference between a bubble map and a standard heatmap?
Standard heatmaps arrange data into rigid rectangular treemaps confined by fixed grid structures. A market bubble map uses fluid, circular nodes that can float dynamically or map across two independent numerical axes, such as performance versus volatility. This multi-axis arrangement makes relative performance and volume clustering much faster to spot visually.
Can visual bubble maps replace traditional stock charting software?
Bubble maps do not replace technical charting terminals; they complement them. A visual map functions as a high-level radar to discover emerging setups and sector divergence across thousands of tickers. Once you spot an outlier node, you transition to traditional candlestick charts and order books to execute precise technical analysis.
How often do live market bubble visualizers update during active sessions?
Live visualizers update dynamically throughout the trading day to reflect continuous price shifts and volume accumulations. Real-time data feeds refresh node sizes, saturation levels, and spatial positions as trades clear across exchanges. This low-latency refresh allows intraday operators to observe sector-wide momentum shifts as they develop during active market hours.
Can beginner investors use bubble maps without advanced financial training?
Beginner investors can interpret bubble maps immediately because the interface relies on intuitive visual cues rather than dense financial jargon. Recognizing that larger circles carry more market weight and brighter green nodes lead market performance requires zero technical training. The platform provides immediate visual clarity while offering room for deeper multi-variable filtering as analytical skills advance.
Market information on this page is for education and general information only. It is not investment advice or a recommendation to buy or sell any asset.