 BubbleMarkets
Stock Market Heat Map: The Visual Guide to Scanning Real-Time Market Trends

With semiconductor stocks commanding roughly 20% of the entire S&P 500, a green headline index can easily mask aggressive distribution across hundreds of underlying equities. Scanning dense tabular watchlists or fragmented news feeds makes it difficult to separate index-weighted mega-caps from genuine market-wide participation. You likely know the frustration of parsing endless columns of percentage changes, only to spot a macro sector rotation after the primary move has already finished. A functional stock market heat map eliminates this operational friction by compressing multi-dimensional market breadth into an immediate, scannable visual field.
This guide demonstrates how to read, analyze, and leverage visual heat maps to pinpoint capital flows in seconds. You will learn to decode block sizes and color saturation hierarchies, detect subtle breadth divergences between index heavyweights and mid-caps, and establish a reliable five-minute pre-market scanning routine for everyday data inspection.
Key Takeaways
- Learn how a stock market heat map translates complex market capitalization and price changes into proportional, color-graded visual grids.
- Detect underlying market breadth divergence by isolating mega-cap weightings from broader mid-cap participation.
- Identify institutional sector rotation in real time as capital transitions between defensive safe havens and cyclical growth industries.
- Establish a structured five-minute pre-market scanning routine to gauge index dispersion and directional sentiment before the open.
- Compare hierarchical treemaps with dynamic multi-asset bubble visualizers to validate equity trends against bond yields and commodities.
What Is a Stock Market Heat Map and How Does It Work?
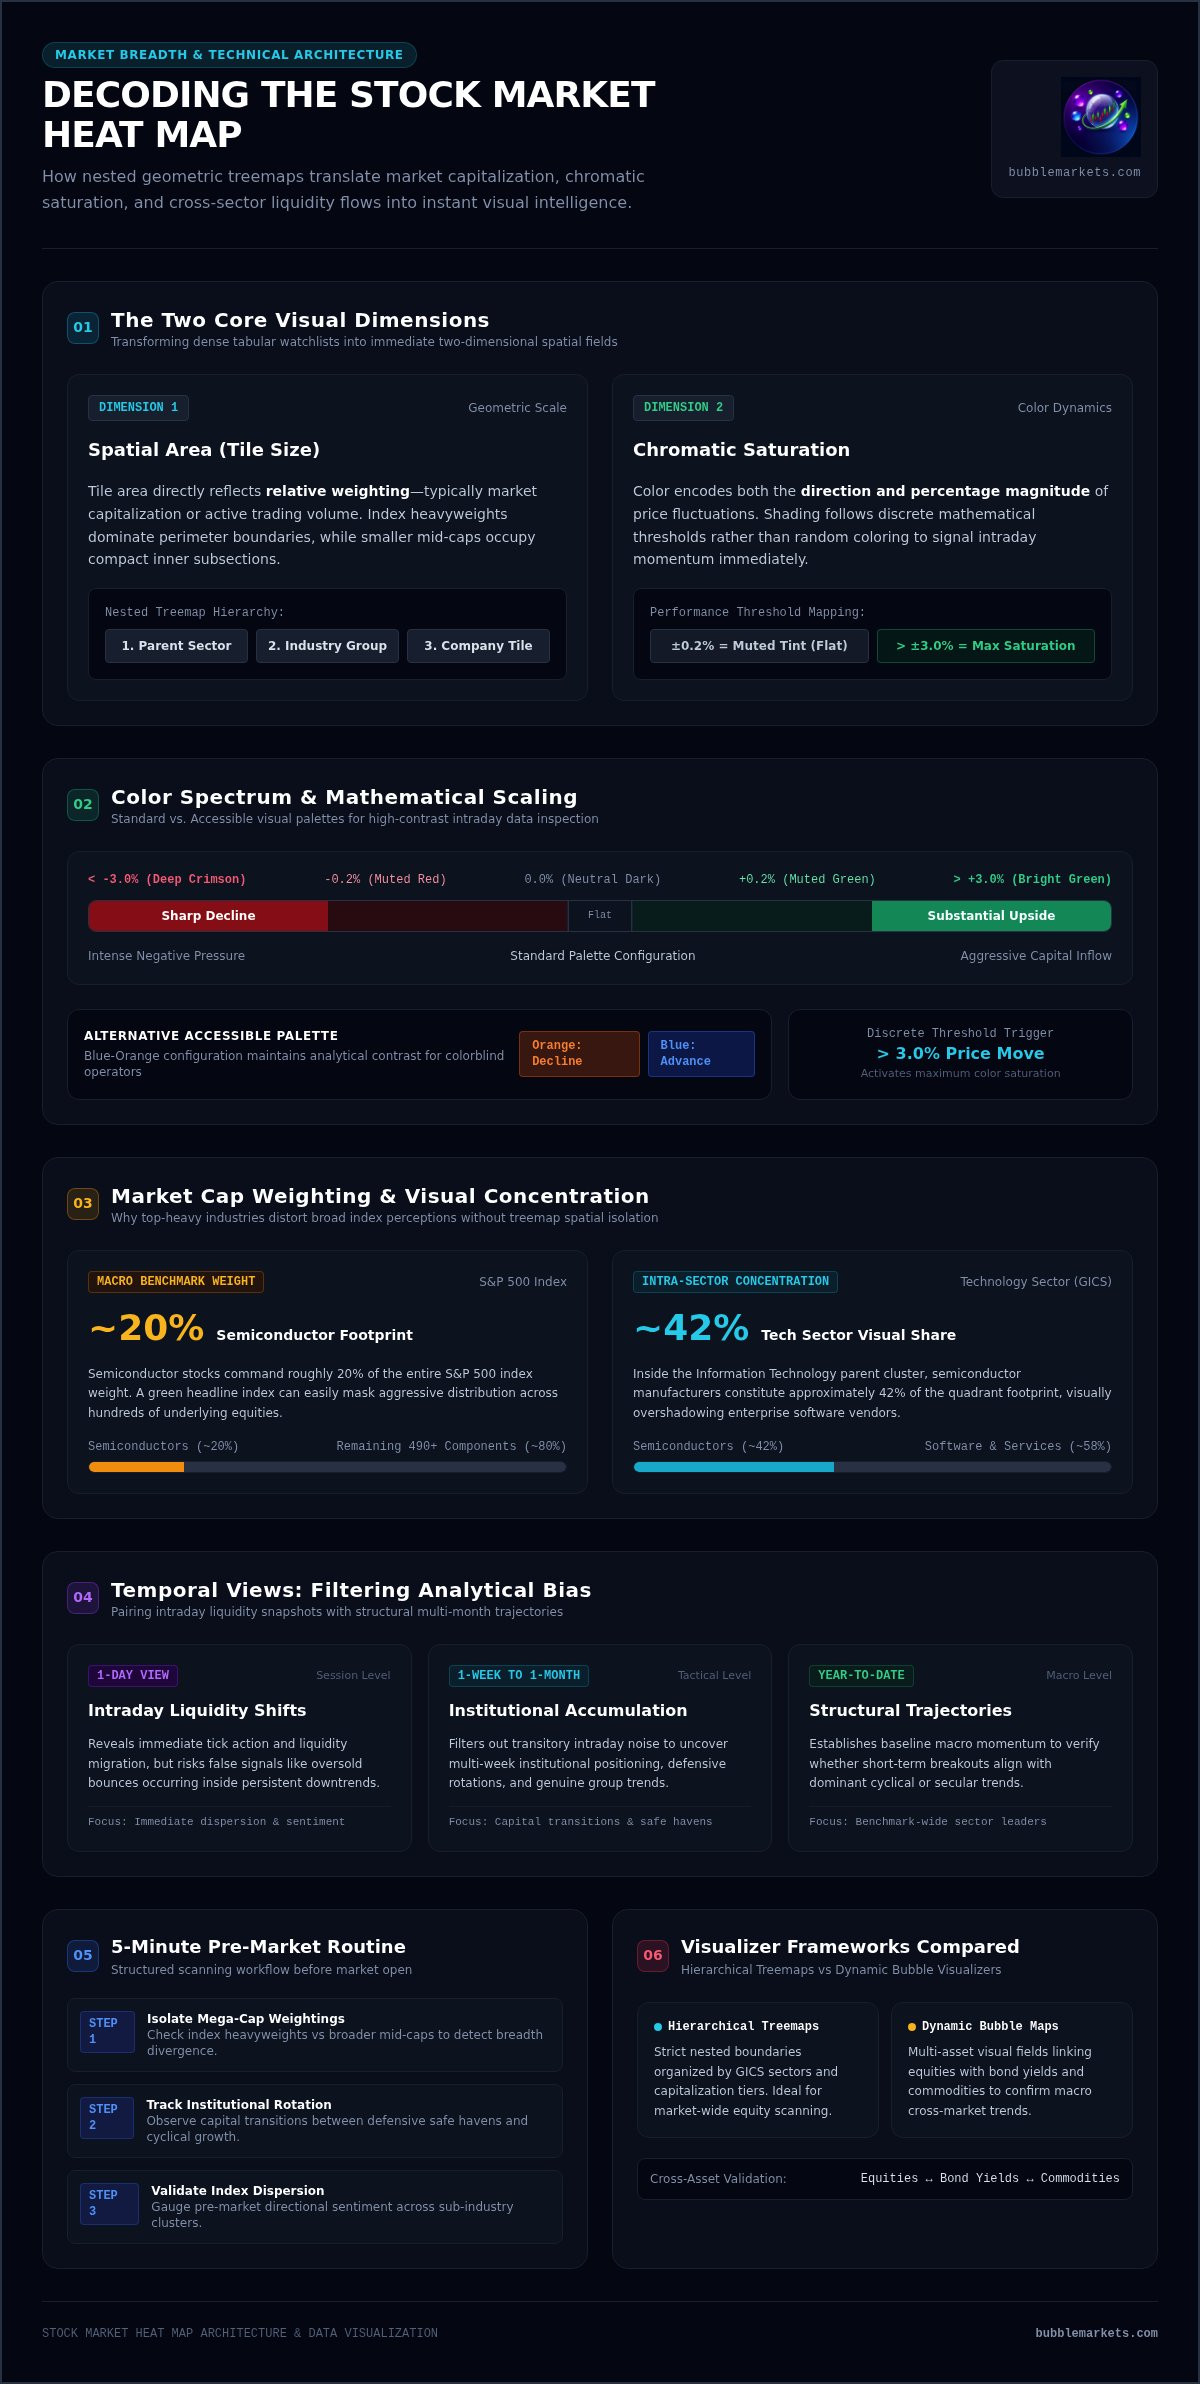
A stock market heat map is a two-dimensional hierarchical visualizer that translates market breadth and price action into nested geometric tiles. Rather than forcing you to scan hundreds of rows across dense tabular ticker lists, the interface organizes market data across two simultaneous visual dimensions: spatial area and chromatic saturation. Tile area reflects relative weighting, typically market capitalization or active trading volume, while color encodes the direction and percentage magnitude of price fluctuations. This spatial arrangement lets you evaluate broader market sentiment and sector-level dynamics in a single visual pass.
The Mechanics of Treemap Visualization
At its operational core, the interface relies on treemapping algorithms to partition screen space into structured categories. The primary canvas divides into parent sectors, such as Technology, Financials, or Healthcare. These parent boundaries then subdivide into industry groups, which finally split into individual company tiles. As live tick data feeds into the visualizer, the algorithm recalculates relative proportions dynamically:
- Parent containers: Allocate primary real estate according to aggregate sector capitalization within the broader benchmark.
- Industry subdivisions: Group related corporate tickers into distinct sub-clusters to reveal intraday group correlations.
- Individual company tiles: Scale proportionally to each asset's market cap, ensuring index heavyweights occupy clear visual prominence over secondary components.
Color Scaling and Performance Intensity
Chromatic gradients deliver instant performance feedback across active trading sessions. Standard displays deploy an intuitive spectrum: deep crimson indicates sharp declines, neutral dark tones mark flat price action, and bright green highlights substantial upside. Saturation levels reflect discrete mathematical thresholds rather than random shading. A 0.2% fluctuation presents as a muted tint, whereas price moves exceeding 3% trigger maximum saturation. High-end platforms also provide accessible palettes, including blue-orange configurations, ensuring high-contrast readability for colorblind operators without sacrificing analytical precision.
Core Components: Decoding Size, Hierarchy, and Temporal Views
Deciphering a stock market heat map requires understanding how graphical hierarchy mirrors underlying market structure. A benchmark map isn't a flat collection of identical squares; it's an organized architecture where market capitalization directly dictates boundary dimensions. Heavyweight equities dominate the perimeter, while smaller components occupy compact subsections. Filtering tools let you isolate specific exchanges or capitalization tiers, preventing secondary liquidity pools from getting lost beneath trillion-dollar balance sheets.
Sectoral Categorization and Sub-Industry Grouping
Standard heat maps organize equities using established frameworks like the Global Industry Classification Standard (GICS). Parent sectors act as outer boundaries, enclosing distinct sub-industries within defined visual borders. For instance, semiconductor manufacturers sit directly beside enterprise software vendors inside the broader Information Technology cluster. Because semiconductor equities constitute approximately 42% of the technology sector, their visual footprint dominates that quadrant. Usability research on treemap data visualization demonstrates that spatial nesting lets operators spot correlated peer moves without toggling across disparate industry index quotes.
Selecting Temporal Parameters for Clearer Context
Single-session maps reveal immediate liquidity shifts, but relying exclusively on one-day views introduces analytical bias. An aggressive green print might simply reflect an oversold bounce inside a persistent six-month downtrend. Conversely, switching temporal parameters to one-week, one-month, or year-to-date perspectives filters out transitory intraday volatility and isolates multi-week institutional accumulation. Effective data inspection pairs active intraday feeds with multi-month structural trajectories. Configuring dynamic views across specialized market screener and heat map workbenches helps you verify whether an intraday breakout aligns with macro sector momentum before drawing operational conclusions.
How to Read a Stock Heat Map to Identify Market Trends
Reading a stock market heat map effectively requires looking beyond top-line color impressions. Benchmark indices are market-cap weighted, which means a handful of massive enterprises can pull an entire index higher while underlying components deteriorate. A disciplined visual inspection treats the heat map as a diagnostic workbench, scanning for participation breadth, inter-sector capital migration, and isolated divergence across specific asset classes.
Spotting Market Breadth and Hidden Divergence
Market breadth measures how widely performance extends across constituent equities rather than just index heavyweights. When two or three multi-trillion-dollar technology names flash bright green while the surrounding field of mid-cap tiles remains deep crimson, the market displays narrow leadership. This breadth divergence signals internal fragility: headline indices appear resilient, but the majority of stocks are experiencing net distribution. Conversely, a uniform distribution of green across small and mid-cap blocks confirms systemic participation and broad institutional support.
Tracking Sector Rotation in Real Time
Capital constantly cycles between defensive shelters and cyclical growth sectors based on prevailing macroeconomic expectations. During risk-on phases, liquidity typically migrates toward industrials, technology, and materials, leaving defensive utilities and consumer staples subdued. Using a real-time stock market heat map exposes these institutional rotations as they occur. If energy and industrial tiles rally while interest-rate-sensitive real estate contracts, you can immediately identify an active repositioning event across the liquidity curve.
Isolating High-Conviction Market Outliers
Visual anomalies within industry clusters provide immediate operational signals. When a single bright green tile sits marooned inside a uniformly declining financial or healthcare cluster, it indicates decoupled idiosyncratic strength. These solitary performers often reflect company-specific catalysts, such as earnings surprises, restructuring announcements, or acquisition activity. Spotting an outlier visually allows you to isolate that asset and cross-reference its price action against underlying volume surges without sifting through noise.
A Step-by-Step Daily Routine for Scanning Market Heat Maps
Establishing a disciplined inspection routine transforms visual data into structured operational cues. Rather than reacting to fragmented news alerts, practical operators execute a systematic four-step sequence each morning. Integrating a stock market heat map into your pre-bell routine clarifies whether opening momentum stems from broad capital participation or narrow index weightings.
- Step 1: Inspect overnight regional indices: Check European and Asian visualizers to identify early geographic dispersion.
- Step 2: Evaluate domestic sector concentration: Gauge whether color saturation clusters in defensive shelters or cyclical growth engines.
- Step 3: Scan for industry-level divergence: Drill down into dominant sector containers to locate decoupled outliers and volume anomalies.
- Step 4: Cross-examine multi-asset signals: Confirm equity direction against sovereign bond yields and commodity movements.
Pre-Market Preparation and Global Sentiment Check
Prior to the opening bell, scan international visualizers across European and Asian sessions. If Asian tech clusters decline while European industrials push higher, regional flows reveal localized risk tolerances. Next, inspect domestic pre-market price changes on your stock market heat map. When headline index futures advance but constituent tiles show mixed or negative pre-market prints, expect selective, choppy price action at the open.
Intraday Monitoring and Cross-Asset Confirmation
Market dynamics shift during key liquidity transitions, particularly around the European market close and mid-day lulls. Inspecting your visualizer during these intervals reveals whether morning trends have enduring institutional backing. Cross-asset validation remains essential here. An equity rally doesn't signal broad conviction if sovereign bond yields spike unexpectedly or commodity markets show defensive positioning. Validate inter-market alignment across asset classes directly; you can launch free live market bubble maps to cross-reference equity behavior against bond yields and commodities within a unified visual workspace.
Beyond Standard Treemaps: The Power of Multi-Asset Visualizers
Traditional treemaps excel at structural categorization, but modern data analysis often requires more fluid geometry. While a standard stock market heat map locks companies into rigid rectangular containers based on capitalization, multi-asset visualizers introduce flexible dimensions. Capital doesn't operate inside isolated equity silos; it flows across currencies, sovereign bonds, digital assets, and commodities. Tracking these systemic currents requires visual tooling that can compare disparate asset classes without forcing them into uniform market-cap boundaries.
Treemaps vs. Bubble Maps: Choosing the Right Tool
Hierarchical treemaps and physics-based bubble maps serve complementary operational functions. Treemaps provide an organized index overview, anchoring components to their parent sectors so you can evaluate broad index breadth. Bubble maps, by contrast, unbind assets from rigid grids. They map relative percentage velocity, active trading volume, and momentum into floating interactive spheres. When you need to assess benchmark weighting and sector health, a treemap provides structural stability. When you need to scan for rapid intraday momentum, volume breakouts, or cross-market volatility spikes, bubble maps highlight those anomalies instantly.
Building an Integrated Visual Workbench with BubbleMarkets
Modern market analysis requires cross-examining multiple asset classes side by side. Instead of toggling between disconnected software applications, operators can use BubbleMarkets as a centralized visual workbench. The platform combines interactive bubble visualizers with traditional hierarchical heat maps, letting you inspect equities, crypto, commodities, and bonds within an integrated environment:
- Multi-asset coverage: Monitor global stock indices, crypto assets, ETF flows, and bond yields on a single screen without manual data consolidation.
- Custom screeners and portfolio tracking: Build targeted watchlists and set custom price alerts to isolate high-conviction assets.
- AI market summaries: Digest complex multi-asset movements rapidly through concise, automated contextual text summaries.
By pairing a traditional stock market heat map for benchmark structure with multi-asset bubble maps for velocity inspection, you eliminate visual blind spots. This dual approach transforms raw tick feeds into clear operational context, letting you track market dynamics with minimal friction.
Optimizing Your Daily Market Visual Workflow
Decoding spatial hierarchy and color saturation transforms raw tick noise into immediate analytical clarity. A disciplined stock market heat map workflow helps you separate narrow mega-cap rallies from genuine broad participation, spot sector rotations before trends mature, and eliminate reliance on dense tabular ticker rows. When you track how capital migrates between industry clusters, daily market preparation becomes faster, sharper, and far more dependable.
Expanding your visual inspection beyond single-index equities completes the operational picture. Modern markets don't move in isolation; equity shifts routinely interact with sovereign bond yields and commodity cycles. To cross-examine these interconnected currents without friction, explore interactive real-time visualizers at BubbleMarkets. Combining browser-based bubble visualizers, dynamic screening tools, and integrated AI market summaries equips you to navigate global liquidity pools with total clarity.
Frequently Asked Questions
What is the main difference between a stock market heat map and a traditional stock screener?
A traditional screener filters assets using tabular criteria like price-to-earnings ratios or volume thresholds, displaying results in rows and columns. A stock market heat map translates performance and relative scale into two-dimensional visual space instantly. Instead of parsing text rows, you spot sector groupings, relative market capitalization, and performance intensity through color saturation and tile dimensions at a glance. Both tools complement each other, but heat maps prioritize rapid visual pattern recognition over row-by-row filtering.
How do market capitalization weights affect the layout of a stock market heat map?
Market capitalization determines the physical surface area allocated to each company tile on the visualizer. Mega-cap corporations command massive rectangular blocks, while small or mid-cap equities occupy compact sub-tiles within their assigned sector boundaries. This hierarchical scaling ensures visual prominence matches actual index influence, reflecting how large enterprise price swings exert disproportionate mathematical pull over benchmark indices compared to secondary components.
Can a stock market heat map indicate whether an entire market is overbought or oversold?
A heat map reveals short-term extreme extensions through intense, widespread color saturation. When nearly every sector tile displays maximum bright green across multiple sessions, market breadth indicates an aggressive, potentially stretched rally. Conversely, uniform deep crimson across defensive and cyclical sectors signals pervasive distribution or panic selling. However, confirming overbought or oversold extremes requires pairing visual saturation with technical indicators like moving average breadth metrics rather than relying on color alone.
Why do some stock heat maps show green indices while most individual stocks appear red?
This divergence occurs because major benchmark indices use market-cap weighting rather than equal weighting. When a handful of dominant mega-cap technology companies experience strong upward momentum, their combined valuation gains can offset widespread losses across hundreds of smaller constituents. A stock market heat map highlights this internal disparity immediately, revealing narrow index leadership where headline gains hide underlying breadth weakness across mid-cap and defensive sectors.
How often do real-time stock market heat maps update their pricing and sizing data?
Real-time visualizers update pricing data continuously as trades execute on primary exchange feeds during active market hours. Price changes trigger dynamic shifts in chromatic saturation within seconds of execution. However, tile area recalculations often adjust at structured intervals or daily closes because market capitalization proportions shift gradually. Platforms with streaming feeds refresh percentage metrics tick by tick, providing immediate feedback on intraday capital rotation and volume surges.
What is the practical difference between a standard stock treemap and a market bubble map?
Standard treemaps lock assets into fixed, nested rectangular grids organized by sector hierarchies and market capitalization. Bubble maps unbind equities from rigid perimeters, representing assets as floating, physics-based spheres. In a bubble map, size can dynamically represent trading volume or percentage momentum rather than market cap alone. This visual flexibility helps operators quickly detect unusual trading volume and rapid price velocity without strict sector boundaries constraining the visual field.
Can I use stock market heat maps to monitor international equities and foreign bourses?
Yes, modern visualizers provide extensive coverage across international equity bourses and regional benchmarks. Platforms map foreign exchange listings across European, Asian, Japanese, and Indian markets, grouping assets by local exchanges or global industry classifications. Scanning international heat maps during pre-market domestic hours helps you evaluate overnight liquidity flows, currency impacts, and regional risk sentiment before local trading sessions officially commence.
Frequently asked questions
What is the main difference between a stock market heat map and a traditional stock screener?
A traditional screener filters assets using tabular criteria like price-to-earnings ratios or volume thresholds, displaying results in rows and columns. A stock market heat map translates performance and relative scale into two-dimensional visual space instantly. Instead of parsing text rows, you spot sector groupings, relative market capitalization, and performance intensity through color saturation and tile dimensions at a glance. Both tools complement each other, but heat maps prioritize rapid visual pattern recognition over row-by-row filtering.
How do market capitalization weights affect the layout of a stock market heat map?
Market capitalization determines the physical surface area allocated to each company tile on the visualizer. Mega-cap corporations command massive rectangular blocks, while small or mid-cap equities occupy compact sub-tiles within their assigned sector boundaries. This hierarchical scaling ensures visual prominence matches actual index influence, reflecting how large enterprise price swings exert disproportionate mathematical pull over benchmark indices compared to secondary components.
Can a stock market heat map indicate whether an entire market is overbought or oversold?
A heat map reveals short-term extreme extensions through intense, widespread color saturation. When nearly every sector tile displays maximum bright green across multiple sessions, market breadth indicates an aggressive, potentially stretched rally. Conversely, uniform deep crimson across defensive and cyclical sectors signals pervasive distribution or panic selling. However, confirming overbought or oversold extremes requires pairing visual saturation with technical indicators like moving average breadth metrics rather than relying on color alone.
Why do some stock heat maps show green indices while most individual stocks appear red?
This divergence occurs because major benchmark indices use market-cap weighting rather than equal weighting. When a handful of dominant mega-cap technology companies experience strong upward momentum, their combined valuation gains can offset widespread losses across hundreds of smaller constituents. A stock market heat map highlights this internal disparity immediately, revealing narrow index leadership where headline gains hide underlying breadth weakness across mid-cap and defensive sectors.
How often do real-time stock market heat maps update their pricing and sizing data?
Real-time visualizers update pricing data continuously as trades execute on primary exchange feeds during active market hours. Price changes trigger dynamic shifts in chromatic saturation within seconds of execution. However, tile area recalculations often adjust at structured intervals or daily closes because market capitalization proportions shift gradually. Platforms with streaming feeds refresh percentage metrics tick by tick, providing immediate feedback on intraday capital rotation and volume surges.
What is the practical difference between a standard stock treemap and a market bubble map?
Standard treemaps lock assets into fixed, nested rectangular grids organized by sector hierarchies and market capitalization. Bubble maps unbind equities from rigid perimeters, representing assets as floating, physics-based spheres. In a bubble map, size can dynamically represent trading volume or percentage momentum rather than market cap alone. This visual flexibility helps operators quickly detect unusual trading volume and rapid price velocity without strict sector boundaries constraining the visual field.
Can I use stock market heat maps to monitor international equities and foreign bourses?
Yes, modern visualizers provide extensive coverage across international equity bourses and regional benchmarks. Platforms map foreign exchange listings across European, Asian, Japanese, and Indian markets, grouping assets by local exchanges or global industry classifications. Scanning international heat maps during pre-market domestic hours helps you evaluate overnight liquidity flows, currency impacts, and regional risk sentiment before local trading sessions officially commence.
Market information on this page is for education and general information only. It is not investment advice or a recommendation to buy or sell any asset.