 BubbleMarkets
AI Market Summary Tool: How to Compare Options in 2026

A concise market summary can save time, but it can’t tell you whether its claims hold up. The right ai market summary tool helps you get oriented across market information, then gives you a clear path to verify what matters.
If summaries feel vague or disconnected from your charts, screeners, and portfolio view, pay attention to that. AI can condense information, but it may leave out context or include details that need checking. Treat the output as a starting point, not a conclusion.
This guide explains what AI market summaries can and can’t do, and how to compare tools using practical criteria such as coverage, timeframe visibility, and fit with your research routine. You’ll also see how summaries can work alongside visual market data, screening, and portfolio monitoring. BubbleMarkets brings AI-generated summaries together with interactive market visualizations and research tools across multiple asset classes, so you can move from a written overview to a relevant market view. The goal is a workflow that stays useful and verifiable, with your own checks at the center.
Key Takeaways
- An ai market summary tool can condense market context, but it doesn’t replace price verification or make trading decisions for you.
- Compare tools by asset coverage, clarity, timeframe visibility, and how easily you can inspect supporting market context.
- Keep the asset group and timeframe consistent when reviewing a summary against market data.
- Use a repeatable workflow: define your question, review the summary, inspect the data, and note what remains uncertain.
- BubbleMarkets combines AI-generated summaries with market visualizations across stocks, crypto, ETFs, commodities, bonds, and forex.
What an AI Market Summary Tool Does, and What It Does Not
An AI market summary tool generates concise market context from financial information. It can organize observations into readable language, helping you identify what to examine across an asset, sector, or broader market theme. In short, it condenses financial information into a brief account of market conditions, but it doesn’t establish what will happen next.
That distinction matters. A summary might describe that an asset’s price rose over a selected period, or that several assets in a category moved in the same direction. Those are observations, provided they match the underlying data. Saying why the move happened is interpretation. Saying what the price will do next is a forecast. Recommending a trade goes further still. Don’t treat these different types of statements as interchangeable.
What information can an AI market summary help organize?
Depending on the information available to a particular tool, a summary may help orient you to observed price changes, differences across asset groups, or themes in market coverage. For example, it might prompt you to check whether a move is limited to one asset or visible across a wider category. That can narrow what you inspect, but it doesn’t prove a cause or establish that a trend will continue.
Market intelligence is the broader practice of gathering and interpreting information about market conditions. A summary can provide a compact entry point to that work, but check how it separates data from analysis. Ask whether a statement describes a measured move, suggests a possible driver, or expresses an outlook. If the distinction isn’t clear, treat the statement as a prompt to investigate, not as a confirmed fact.
Where summaries fit in independent market research
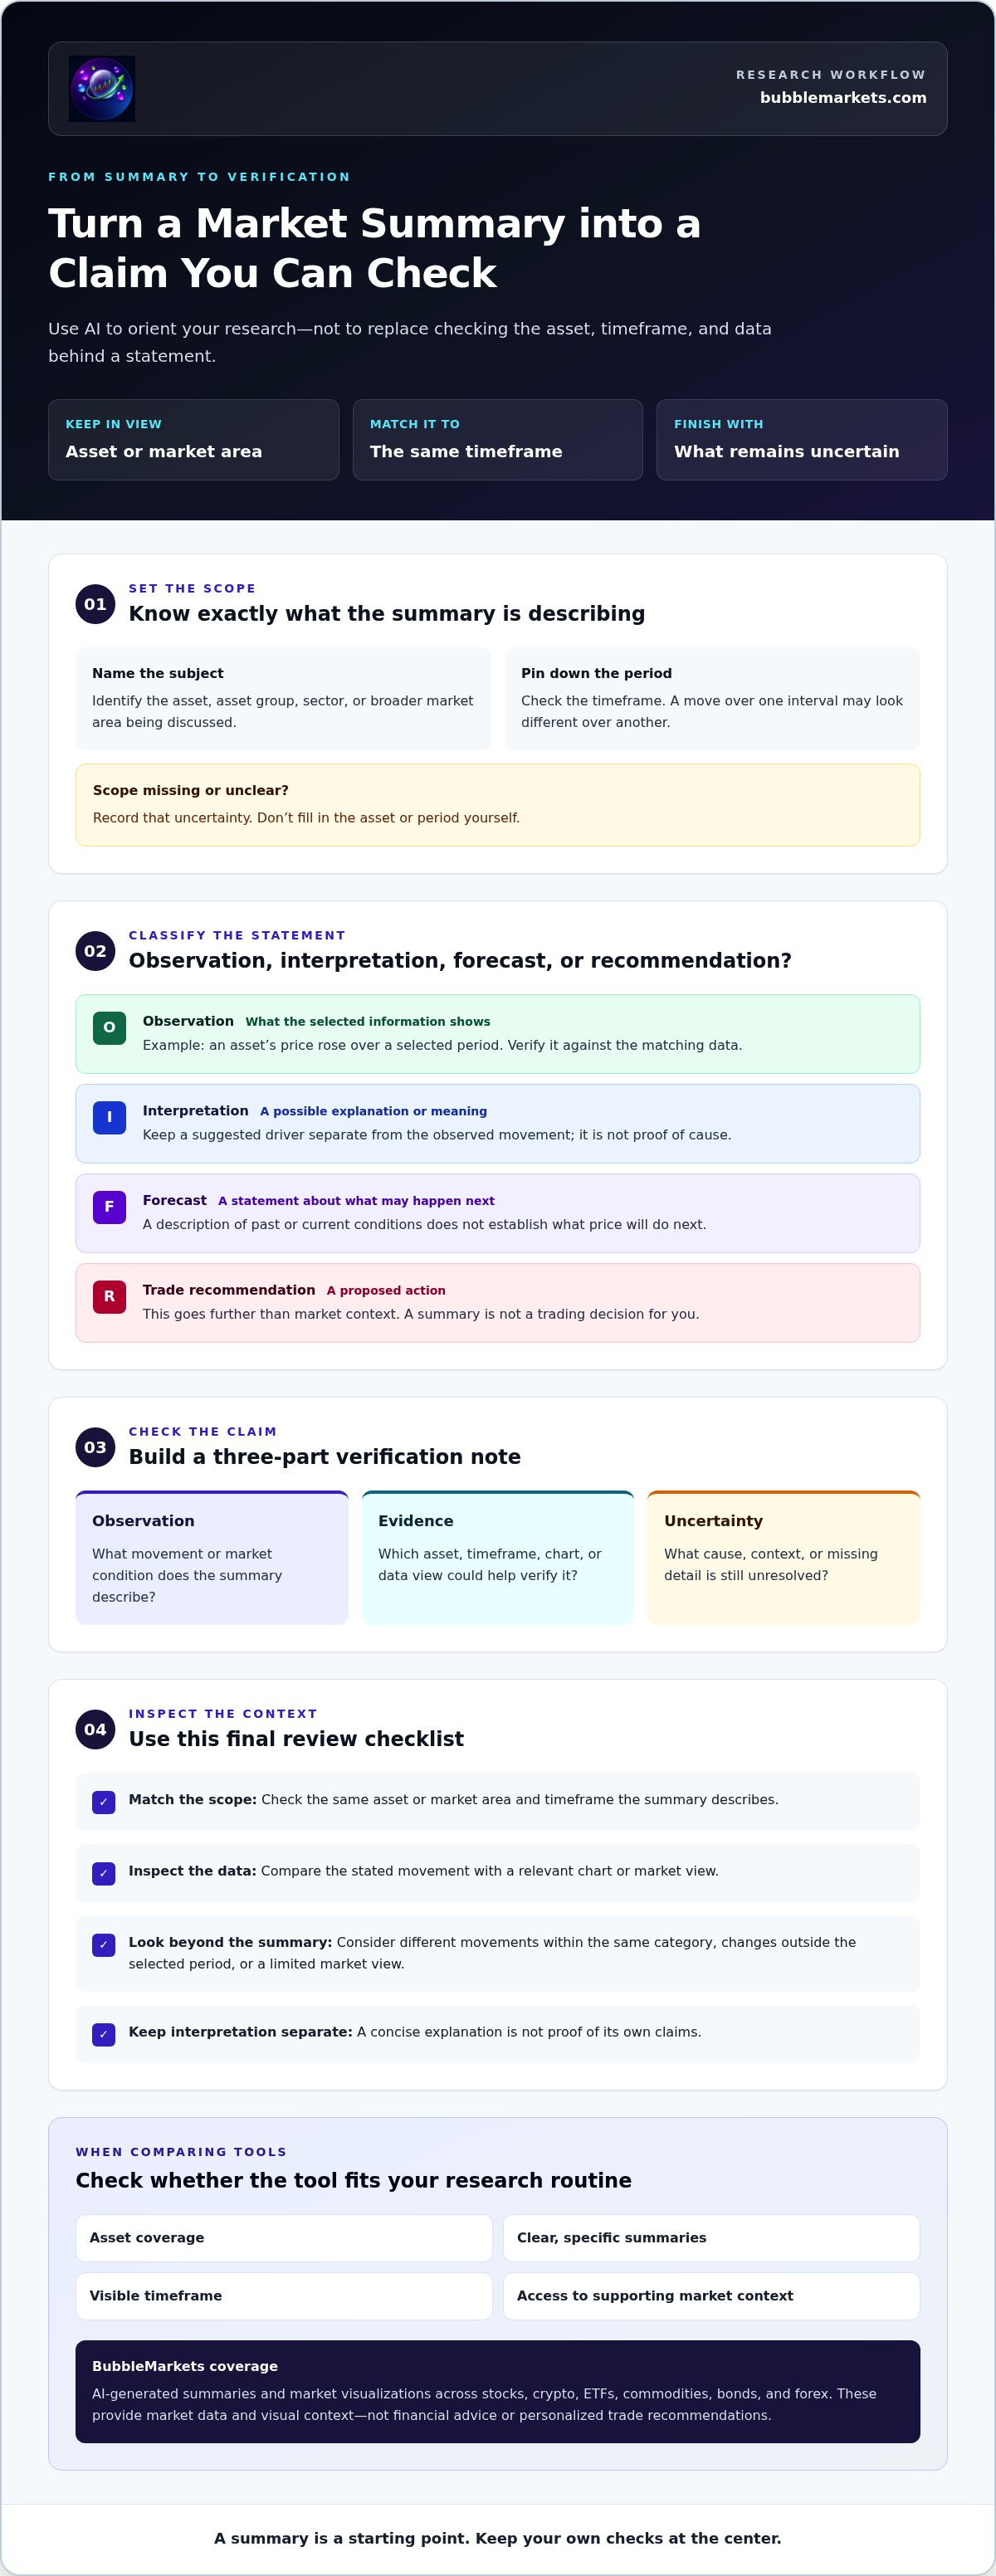
Use a summary to decide what to inspect next, not to reach a final research conclusion. Check the relevant asset and timeframe, then compare the summary’s description with the underlying market data. A price change over one interval may look different over another, so keep the timeframe consistent when testing a claim. If the summary doesn’t make its scope clear, record that uncertainty rather than filling in the gap yourself.
For a practical check, separate each takeaway into three parts:
- Observation: What movement or market condition does the summary describe?
- Evidence: Which asset, timeframe, or data view could help you verify it?
- Uncertainty: What cause, context, or missing detail remains unresolved?
This process helps you focus your review without skipping the checks needed to assess a claim. BubbleMarkets pairs AI-generated market summaries with visualization tools, including market bubble maps. Its platform covers stocks, crypto, ETFs, commodities, bonds, and forex. These tools provide market data and visual context, not financial advice or personalized trade recommendations.
How AI Market Summaries Turn Market Data into Useful Context
At a high level, an AI market summary turns financial information into a short written account: information is processed, observations are condensed, and language presents the result as context. The exact inputs and methods vary by tool. Don’t assume which sources, calculations, or models produced a particular summary unless the tool explains them.
Coverage sets the boundaries of what a summary can reasonably describe. A view focused on one asset can’t establish what is happening across an entire market. Timeframe matters too: a movement over a short interval may differ from the pattern over a longer one. If a summary omits its asset scope or period, important context is missing.
A data observation reports what the selected information shows; an AI-generated interpretation offers a possible explanation of what that observation means. Keep the two separate. For a broader overview of how AI tools are used to organize research, AI market research tools provides useful context, though it isn’t documentation for any specific market summary product.
What makes a market summary specific rather than generic?
Look for a clear subject, market area, and time period. “Several technology shares declined during the session” is more testable than “markets are under pressure,” because it identifies a category and a time boundary. The first statement still needs checking, but it gives you a defined place to start.
Useful summaries also point toward observations you can inspect, such as a direction of movement or a contrast between asset groups. Broad statements without a named subject or timeframe are difficult to assess. Treat them as prompts to narrow your question, not as evidence of a defined trend.
Why verification matters when reading AI-generated analysis
Generated language can sound coherent while leaving out relevant details. Check notable claims against the matching asset and timeframe in a chart or data view. Then ask what the summary may have missed: a different movement among assets in the same category, a change outside the selected period, or a limited view of the market.
- Confirm the scope: Match the asset or market area and timeframe.
- Inspect the data: Compare the stated movement with the relevant chart or market view.
- Mark interpretation: Keep possible explanations separate from observed values.
An ai market summary tool can make patterns easier to locate, but a concise explanation is not proof of its own claims. Keep uncertainty visible in your notes and verify before using an interpretation in further research. For written summaries alongside visual context, BubbleMarkets’ market visualizations let you inspect market data in a graphical format.
How to Compare AI Market Summary Tools for Research
Compare tools against the research task you need to complete, not the strength of their promotional language. An ai market summary tool is more useful when its coverage matches your market, its wording is specific enough to check, and its summaries sit alongside context you can inspect. When comparing tools, use the same asset group and timeframe so you’re comparing like with like.
Which evaluation criteria matter most?
Start with coverage: a tool focused on stocks may not fit research across crypto, bonds, commodities, or forex. Then assess whether summaries identify the relevant market area and period, and whether the observation is clear enough to check without guessing what it refers to. Charts, screeners, and portfolio views can add useful context, but their presence doesn’t establish that a summary is accurate.
Use this checklist to structure a comparison:
| Criterion | Why it matters | Questions to assess |
|---|---|---|
| Asset and market coverage | Coverage determines whether the tool fits your research scope. | Which asset groups and regions can you examine? |
| Summary clarity | Specific wording makes claims easier to evaluate. | Does it name the asset or market area, and describe an observable point? |
| Timeframe visibility | Market observations can change across periods. | Can you identify the interval behind the summary? |
| Supporting context | A summary is easier to check alongside relevant data views. | Are charts, screening, or portfolio context available for your task? |
If portfolio context is part of your process, the portfolio tracking visualizer guide explains how a visual overview can help you inspect holdings alongside market information.
How to distinguish a useful summary from a confident-sounding one
Test the summary with a specific question. If it says a market area strengthened over a period, look for the stated assets and interval in the relevant chart or data view. A useful output gives you a claim you can locate and assess. A broad statement with no clear subject or timeframe may sound decisive, but offers little to verify.
Separate verifiable platform features from claims that need evidence or hands-on testing. Coverage, available charts, and screening functions can be checked in the platform. Claims about source quality, accuracy, or prediction need more than confident product language. Look for clear explanations and supporting evidence rather than relying on unsupported accuracy scores or rankings.
BubbleMarkets combines AI-generated market summaries with visualizations across stocks, crypto, ETFs, commodities, bonds, and forex. Compare the available context against your criteria, then inspect the relevant market view before treating a summary as useful input.
A Practical Workflow for Using an AI Market Summary Tool
A reliable workflow turns a summary into a focused research question, then checks that question against market data. Keep the asset group and timeframe consistent throughout. Otherwise, differences between observations may reflect different inputs rather than a meaningful change.
- Define the question. Choose a specific market, asset group, or portfolio issue to examine. For example, ask whether a particular asset group moved in the same direction over a defined period, rather than asking what the market is doing in general.
- Review the summary. Identify the observations it presents and note the asset scope and timeframe. Separate direct descriptions of movement from explanations about why it happened.
- Inspect the data. Open a relevant chart or market visualization and compare the stated movement with the same assets and period. A chart can add context, but it doesn’t automatically confirm every claim or explanation in the summary.
- Record uncertainty. Note what matches the data, what doesn’t, and what remains unanswered. Keep unresolved questions visible instead of treating a concise summary as complete analysis.
From first scan to a checkable research question
Use the summary to locate what deserves closer attention, not to expand a broad claim beyond its evidence. If it describes strength across a market area, make the statement testable: which assets does it cover, what direction did they move, and over what period? Write down the question before comparing data. That keeps your review anchored to a defined scope rather than a narrative that shifts as you browse.
Verify the context before drawing conclusions
Match the summary’s timeframe to the period shown in the chart. If it refers to a market category, check whether the data view represents that same group or only a subset. Look for contrary movement that could qualify the broad description. If the available view doesn’t answer the question, record the gap; don’t treat missing context as confirmation.
Alerts can help you monitor a specified price condition or market change, while charts show movement in context. Neither function, on its own, verifies an AI-generated interpretation. For a related approach to monitoring, see this real-time market alerts comparison.
To apply this process alongside visual market context, explore BubbleMarkets’ market visualizations and AI summaries. Use the summary to orient your review, then inspect the relevant data and note any remaining uncertainty.
Where BubbleMarkets Fits in an AI Market Summary Workflow
BubbleMarkets brings AI-generated market summaries together with interactive market visualizations. This pairing helps you move from a written overview to a visual view of market activity, then decide what deserves closer inspection. The platform covers stocks, crypto, ETFs, commodities, bonds, and forex, supporting research across more than one market category.
Pair AI-generated summaries with visual market context
Use a summary to orient your review, then open a relevant visualization to examine the market area it describes. BubbleMarkets also offers screeners, portfolio tracking, and price alerts, which add different forms of context to a research routine. A visualization can help you inspect price movement or compare assets, but it doesn’t prove that a generated explanation is correct.
Keep the distinction clear: summaries provide written context, while visual tools help you view market data. Neither should stand in for your own assessment of what the information supports.
Choose a workflow that matches your research needs
If you monitor several asset categories, broad coverage can help you keep related market views in one research environment. If your focus is narrower, start with the market group and visual tools that match your question. BubbleMarkets’ Pro, Professional, and Enterprise subscriptions provide advanced visualization tools, extended market screening, customizable heat maps, portfolio tracking, price alerts, AI-generated market summaries, and deeper data coverage across global asset classes.
A simple way to combine the tools is to assign each one a specific role:
- Summary: Get a concise written orientation to the market context.
- Visualization: Inspect the relevant market view and compare the assets or categories in scope.
- Screener: Narrow the field of assets you want to examine.
- Portfolio tracking and price alerts: Monitor portfolio information and selected price conditions as part of your ongoing process.
These functions support research and monitoring, but they don’t provide personalized investment advice or replace independent judgment. BubbleMarkets is a data visualization platform, not a brokerage or financial adviser. Treat its summaries as one input alongside the market information you inspect, and keep unresolved questions in view rather than assuming the summary tells the whole story.
Explore BubbleMarkets’ market tools to bring AI-generated summaries and visual market context into your research workflow.
Make Your Next Research Check More Deliberate
Judge an ai market summary tool in the context of your own research routine. Pick a market question you regularly investigate, then see whether the summary helps you identify a clear, checkable observation. If it leaves you unsure which asset, period, or data to inspect, that’s useful information about its fit for your workflow.
Keep your standard consistent as you compare options. A practical tool should support your process without asking you to treat generated language as a conclusion. Build around the questions you need to answer, and let verifiable market data guide what you accept.
BubbleMarkets brings AI-generated summaries together with market visualizations and screening, with portfolio tracking and price alerts also available across stocks, crypto, ETFs, commodities, bonds, and forex. Use the summary to orient your review, then inspect the relevant data and decide what warrants further research.
Start with one question, inspect the relevant context, and refine your workflow as you learn what helps. Clearer research begins with a repeatable next step.
Frequently Asked Questions
What is an AI market summary tool?
An AI market summary tool uses software to turn financial information into concise written context. For example, it may help you orient a morning review before you decide which assets need closer attention. Treat its output as a navigation aid, not a verified report: check that the observation matches the relevant market data and period. If the summary makes a causal claim, look for evidence beyond the wording itself.
Can AI summarize stock and crypto markets in the same tool?
Yes, some platforms cover both stocks and crypto, though the available markets and summary formats vary. BubbleMarkets offers market visualizations and AI-generated summaries across asset classes that include stocks and crypto. If you compare the two categories, keep their assets and timeframes distinct; a shared interface doesn’t mean the same market factors or context apply. Review the platform’s coverage rather than assuming a tool supports every asset type.
How accurate are AI-generated market summaries?
Accuracy can vary by claim, available information, and the scope of the summary, so one general accuracy label may not tell you whether a particular statement is reliable. Test concrete claims individually: compare a reported direction or movement with the relevant chart and period. Be more cautious with explanations of why a market moved, since those can be interpretations rather than directly verifiable observations. No summary should be treated as a guarantee of future performance.
Does an AI market summary tool tell me what to buy?
No. A summary may describe or interpret market information, but it isn’t a personalized instruction to buy or sell. BubbleMarkets is a data visualization platform; it doesn’t provide personalized investment recommendations, brokerage, or trade execution. If a summary raises a question about an asset, turn it into a research task, such as checking the relevant data and your own objectives, rather than treating the generated text as an order.
What should I compare when choosing an AI market summary tool?
Compare market coverage, how clearly summaries identify their subject and timeframe, and whether related data views support your review. Test the tools against a research task you actually perform, such as reviewing a specific market category, and note which capabilities are available. Also distinguish product features from broad promotional claims about intelligence or performance. A tool’s fit depends on whether its functions work with your process, not on its label alone.
Can I use an AI market summary as my only source of market research?
It’s better not to rely on a summary alone. Generated text can omit context, so use other relevant information to examine the question it raises. For instance, if a summary describes a company-related market move, review the price data alongside relevant company information instead of assuming the summary explains the cause. Record what you could verify and what remains uncertain. This keeps a concise overview from standing in for a fuller investigation.
Frequently asked questions
What information can an AI market summary help organize?
Depending on the information available to a particular tool, a summary may help orient you to observed price changes, differences across asset groups, or themes in market coverage. For example, it might prompt you to check whether a move is limited to one asset or visible across a wider category. That can narrow what you inspect, but it doesn’t prove a cause or establish that a trend will continue. Market intelligence is the broader practice of gathering and interpreting information about market conditions. A summary can provide a compact entry point to that work, but check how it separates data from analysis. Ask whether a statement describes a measured move, suggests a possible driver, or expresses an outlook. If the distinction isn’t clear, treat the statement as a prompt to investigate, not as a confirmed fact.
What makes a market summary specific rather than generic?
Look for a clear subject, market area, and time period. “Several technology shares declined during the session” is more testable than “markets are under pressure,” because it identifies a category and a time boundary. The first statement still needs checking, but it gives you a defined place to start. Useful summaries also point toward observations you can inspect, such as a direction of movement or a contrast between asset groups. Broad statements without a named subject or timeframe are difficult to assess. Treat them as prompts to narrow your question, not as evidence of a defined trend.
Which evaluation criteria matter most?
Start with coverage: a tool focused on stocks may not fit research across crypto, bonds, commodities, or forex. Then assess whether summaries identify the relevant market area and period, and whether the observation is clear enough to check without guessing what it refers to. Charts, screeners, and portfolio views can add useful context, but their presence doesn’t establish that a summary is accurate. Use this checklist to structure a comparison: If portfolio context is part of your process, the portfolio tracking visualizer guide explains how a visual overview can help you inspect holdings alongside market information.
What is an AI market summary tool?
An AI market summary tool uses software to turn financial information into concise written context. For example, it may help you orient a morning review before you decide which assets need closer attention. Treat its output as a navigation aid, not a verified report: check that the observation matches the relevant market data and period. If the summary makes a causal claim, look for evidence beyond the wording itself.
Can AI summarize stock and crypto markets in the same tool?
Yes, some platforms cover both stocks and crypto, though the available markets and summary formats vary. BubbleMarkets offers market visualizations and AI-generated summaries across asset classes that include stocks and crypto. If you compare the two categories, keep their assets and timeframes distinct; a shared interface doesn’t mean the same market factors or context apply. Review the platform’s coverage rather than assuming a tool supports every asset type.
How accurate are AI-generated market summaries?
Accuracy can vary by claim, available information, and the scope of the summary, so one general accuracy label may not tell you whether a particular statement is reliable. Test concrete claims individually: compare a reported direction or movement with the relevant chart and period. Be more cautious with explanations of why a market moved, since those can be interpretations rather than directly verifiable observations. No summary should be treated as a guarantee of future performance.
Does an AI market summary tool tell me what to buy?
No. A summary may describe or interpret market information, but it isn’t a personalized instruction to buy or sell. BubbleMarkets is a data visualization platform; it doesn’t provide personalized investment recommendations, brokerage, or trade execution. If a summary raises a question about an asset, turn it into a research task, such as checking the relevant data and your own objectives, rather than treating the generated text as an order.
What should I compare when choosing an AI market summary tool?
Compare market coverage, how clearly summaries identify their subject and timeframe, and whether related data views support your review. Test the tools against a research task you actually perform, such as reviewing a specific market category, and note which capabilities are available. Also distinguish product features from broad promotional claims about intelligence or performance. A tool’s fit depends on whether its functions work with your process, not on its label alone.
Can I use an AI market summary as my only source of market research?
It’s better not to rely on a summary alone. Generated text can omit context, so use other relevant information to examine the question it raises. For instance, if a summary describes a company-related market move, review the price data alongside relevant company information instead of assuming the summary explains the cause. Record what you could verify and what remains uncertain. This keeps a concise overview from standing in for a fuller investigation.
Market information on this page is for education and general information only. It is not investment advice or a recommendation to buy or sell any asset.