 BubbleMarkets
Asymmetric Risk Reward: How to Find Trades with Defined Downside

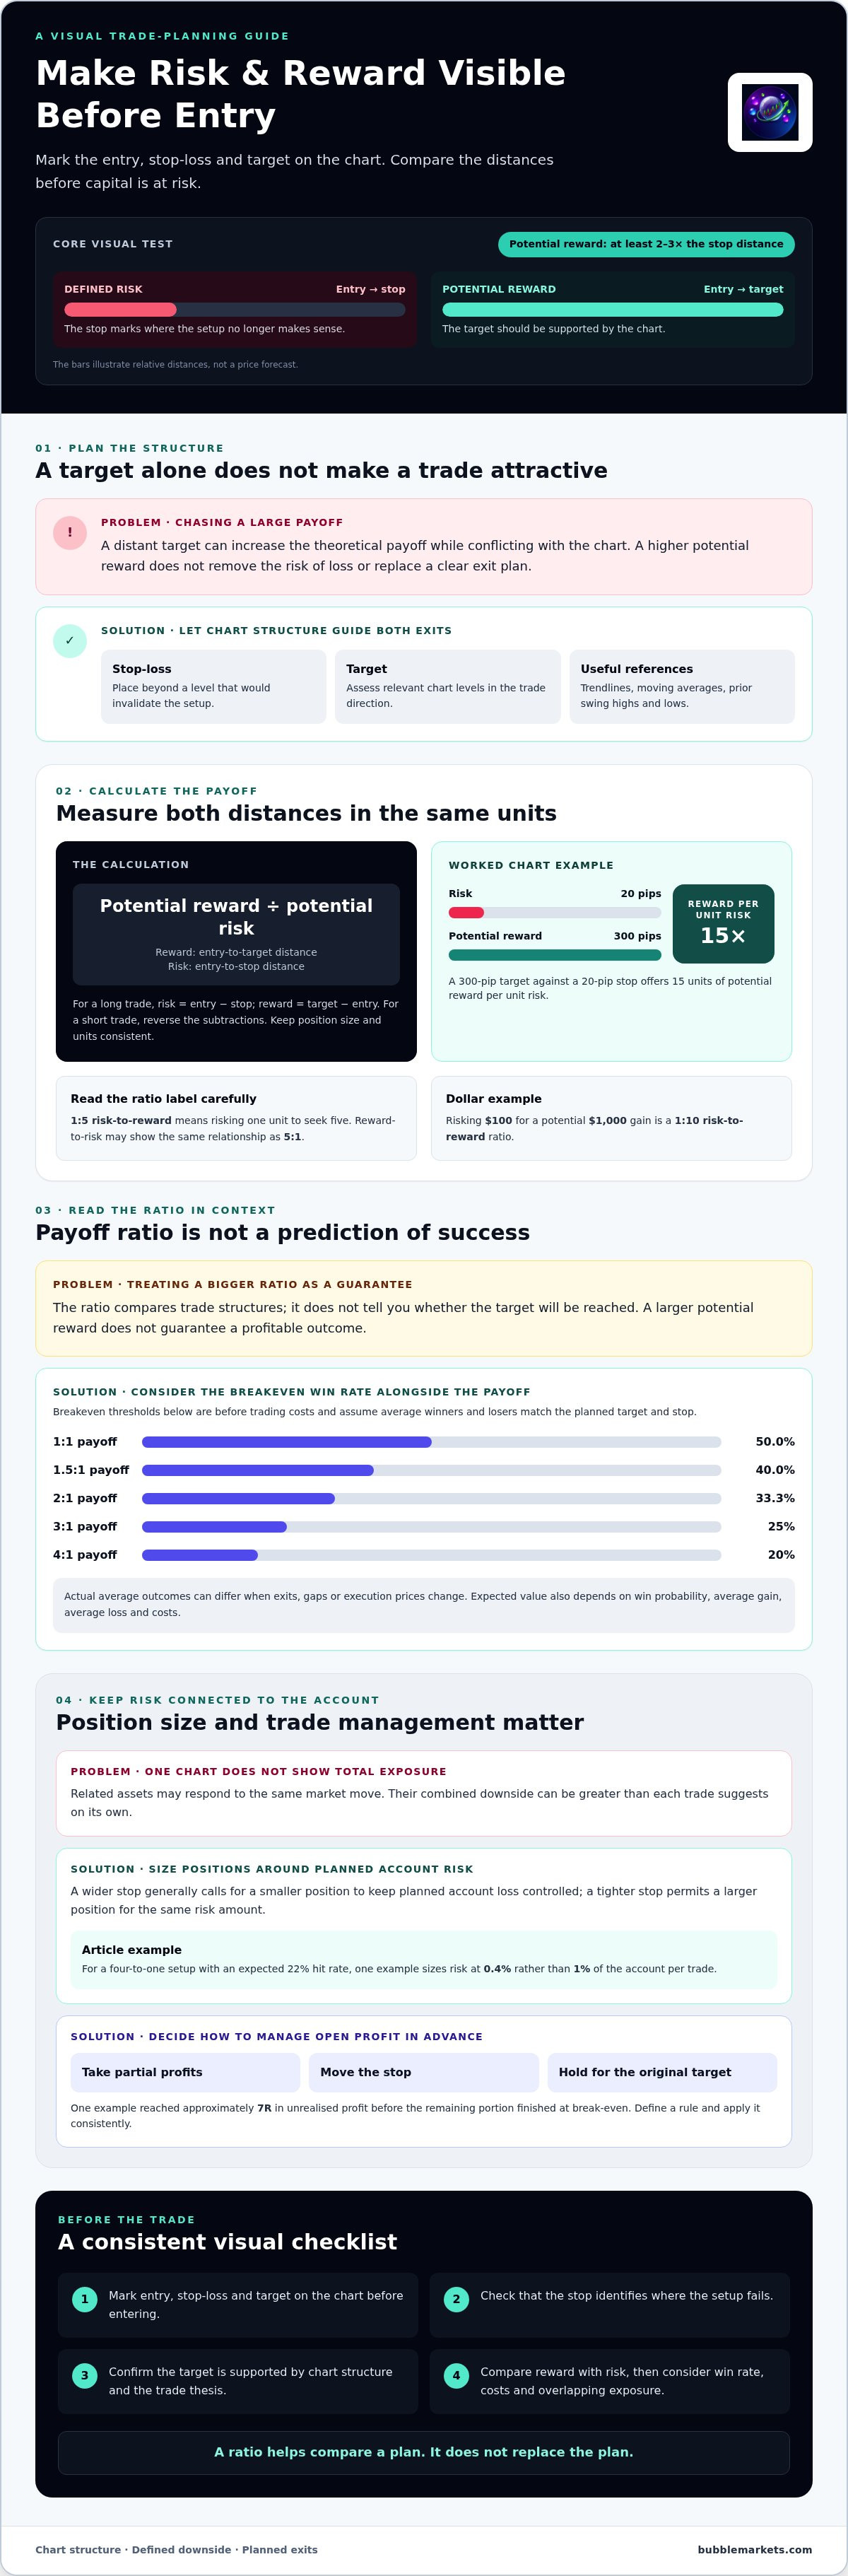
The clearest visual test for how to find asymmetric risk reward trades visually is to mark the entry, stop-loss, and profit target on a chart before entering. Compare the distance from entry to the stop with the distance from entry to the target: a meaningful setup aims for a profit target at least 2-3 times the distance to its stop-loss. This makes the potential loss and reward visible before capital is at risk.
A large target alone doesn’t make a trade attractive. The stop should mark where the setup no longer makes sense, and the target should be supported by the chart. A higher potential reward does not eliminate the risk of loss or replace a clear exit plan.
This article explains what asymmetric risk-reward means, how to assess a setup visually, and how to choose a chart-based target. It also covers examples of high risk-reward trades and ways to compare potential outcomes without treating the ratio as a prediction.
Key Takeaways
- Compare the potential reward with the distance to the stop-loss; the ratio makes the trade’s defined downside visible.
- Assess the win rate alongside the payoff ratio, since a larger potential reward does not guarantee a profitable outcome.
- Choose a target based on the chart’s structure and the trade thesis, rather than stretching it just to improve the ratio.
- Set the entry, stop-loss, and target before entering so you can evaluate the setup consistently.
- Use visual market maps to scan assets and spot areas for further chart analysis, not as a substitute for a trade plan.
What is an asymmetric risk reward setup?
An asymmetric setup has a potential gain greater than its potential loss by a chosen minimum ratio. Its value depends on both the potential payoff and how often the trading plan produces winning trades.
Understanding Risk-Reward Ratios
A risk-reward ratio compares the possible loss from entry to stop-loss with the possible gain from entry to target. A risk-to-reward ratio of 1:5 means risking one unit to seek five; reward-to-risk may express the same relationship as 5:1. Read the labels carefully because notation can reverse the order.
The ratio helps compare trade structures, not predict success. For example, a hypothetical trade risking $100 for a potential $1,000 gain has a 1:10 risk-to-reward ratio. A 1:5 risk-to-reward example risks $1 for a possible $5 gain, while a 1:15 ratio offers $15 potential reward for each unit risked.
Calculating Trade Payoffs
To calculate the ratio, measure the entry-to-stop distance and the entry-to-target distance in the same units, then divide reward by risk. If the entry-to-stop distance is 20 pips and the target is 300 pips away, the trade offers 15 units of potential reward per unit risk.
On a chart, mark the entry, stop, and target before comparing their distances. The stop defines the planned loss; the target defines the potential gain. Together, they give the ratio a visible basis instead of relying on the target alone.
How do you calculate a trade's risk-reward ratio from an entry, stop-loss, and target? For a long trade, subtract the stop price from the entry to find risk, then subtract the entry from the target to find reward. For a short trade, reverse the subtractions. Divide reward by risk, keeping position size and units consistent.
Breakeven win rate changes with the payoff ratio, before trading costs: a 1:1 payoff requires 50.0%, a 1.5-to-1 payoff requires 40.0%, and a 2-to-1 payoff requires 33.3%. At 3-to-1, breakeven is 25%; at 4-to-1, it is 20%.
A 1:5 risk-to-reward trade requires a 16.7% win rate to break even, while a 1:15 ratio needs fewer wins in the simplified calculation. These thresholds assume the average winner and loser match the planned target and stop. Actual average outcomes can differ when exits, gaps, or execution prices change.
How do win rate, risk-reward ratio, and trading costs affect expected value? Expected value combines win probability and average gain, then subtracts loss probability, average loss, and costs. At a 2-to-1 payoff and 40% win rate, expectancy is 0.20R per trade before costs; at 3-to-1 and the same win rate, it is 0.60R.
How can traders backtest and paper-trade visually identified risk-reward setups? Apply the same entry, stop, and target rules to historical charts, record each outcome, and include trading costs. Then paper-trade those rules in live market conditions, tracking whether actual exits and average results align with the test.
Characteristics of an asymmetric risk-reward profile
An asymmetric profile pairs a defined loss with a larger potential gain. Its practical value depends on chart structure, position size, and how the trade is managed after entry.
Chart-Based Stops and Targets
Chart-based stops and targets use visible price structure to identify where a trade thesis fails and where price may encounter resistance or support. A trendline can show a changing boundary, a moving average can provide a reference area, and prior swing highs and lows can frame potential targets. These levels tie risk management to the chart rather than an arbitrary distance.
How do traders use trendlines, moving averages, and chart structure to place stop-losses and targets? They place stops beyond a level that would invalidate the setup, then assess potential targets at relevant levels in the trade direction. The same chart context should support both decisions.
Profit Targets and Returns
A profit target sets the price at which a planned gain is realized, while return on equity compares that gain with the account equity used as its base. In one example, a €3,000 profit on a €10,000 account increases the account by 30%. That percentage translates a chart move into an account-level outcome.
Target placement matters: a distant target can increase the theoretical payoff while conflicting with the chart structure. Base the target on the setup, not on a desired percentage alone.
Position size connects chart risk to account risk. How do position sizing and account risk affect an asymmetric trade? A wider stop generally requires a smaller position to keep the planned account loss controlled, while a tighter stop permits a larger position for the same risk amount. For a four-to-one setup with an expected 22% hit rate, one example sizes risk at 0.4% rather than 1% of the account per trade.
Several trades can share the same market exposure even when their charts look different. Positions in related assets, for example, may respond to the same market move, making their combined downside greater than each trade suggests on its own. Review overlapping exposures as well as individual stops: risk management applies to the group and to each position.
Unrealised profits also change the profile as price moves. One example describes a position reaching approximately 7R in unrealised profit before its remaining portion finished at break-even. A trader can define in advance whether to take partial profits, move a stop, or hold for the original target. Discipline means applying that rule consistently, rather than changing it in response to each price fluctuation.
For ongoing visibility into account positions and price movements, Portfolio Tracking and Price Alerts can help organize monitoring. Use those views to follow open positions; keep entry logic, stop placement, and target decisions grounded in the chart.
Choosing an appropriate risk-reward target
A useful target fits the chart and trade thesis, not just a preferred ratio. To learn how to find asymmetric risk reward trades visually, compare the potential loss with a target the chart structure can support. A ratio helps assess a trade, but it cannot show whether the target is reachable or whether the setup will produce winning outcomes.
A meaningful asymmetric setup has a profit target at least 2-3 times the distance to its stop-loss. Treat these as reference points, not fixed targets for every chart: the potential loss must still sit beyond a level that invalidates the idea.
How can you screen charts for trades with at least a 2:1 or 3:1 risk-reward ratio? Mark a plausible entry, place the stop beyond the chart level that breaks the setup, and measure the distance to a logical target. Keep only charts where the target offers at least two or three times the stop distance.
- Locate the invalidation point: Use the price level that would contradict the trade thesis, not a stop chosen to manufacture a ratio.
- Map a target: Use visible support, resistance, or another chart level that fits the direction of the trade.
- Compare distances: Measure entry-to-stop against entry-to-target using the same price units.
For example, if a potential target sits near major resistance, extending it beyond that area may improve the numbers on paper but lack support from the setup. The target should reflect a plausible path through the price structure. If there is too little room before resistance, passing on the trade preserves the planned risk process.
Assess the ratio alongside the strategy’s average outcomes. A strategy can offer a high potential reward per winning trade and still struggle if losses are more frequent, winners close early, or trading costs erode its edge. Costs matter especially when trading frequently, as repeated charges can reduce returns. Include them in the analysis instead of relying on the chart ratio alone.
Account exposure is another test. A trade that looks asymmetric on its own may overlap with existing portfolio positions, increasing exposure to the same market move. Compare its planned potential loss with the combined risk of related positions before treating it as a separate opportunity.
Predefining the target supports discipline after entry. It can help prevent you from shrinking a profit target, moving a stop-loss, or replacing analysis with hope once capital is committed. Record the chart-based reason for each level, then review whether actual exits followed the plan. Traders learning how to find asymmetric risk reward trades visually can use this review to refine their criteria. The right target is supported by structure and consistent with the strategy’s tested outcomes, not simply the most distant price on the screen.
Defining an asymmetric trade setup
A defined setup records the entry, stop-loss, and profit target before a position begins. This lets you assess planned downside and potential reward against the chart, rather than adjusting levels after the trade moves.
Start with the market structure behind the idea. Mark the price area that supports the entry, then identify the point where a move would invalidate the trade thesis. That point informs the stop-loss. Next, mark a chart-supported target and compare its distance with the stop. This calculation shows whether the setup meets your chosen payoff threshold before you commit capital.
How can support and resistance levels help identify favorable trade entries and exits? Support can help define an area for a potential long entry, while resistance can frame an exit target. If price breaks through the level supporting the idea, the break may signal that the thesis has failed and help inform the stop.
Write down the plan in consistent terms. Record the entry price, stop price, target price, position size, and maximum planned loss in dollars or as a percentage. For example, a stop-loss level can define a maximum loss of 2% of an account. Stating the amount makes the downside concrete before a trade is placed.
- Define the setup: State what chart condition supports the entry and what price action would invalidate it.
- Set the exit levels: Mark the stop and target from the same chart context, then calculate their relative distances.
- Record the exposure: Note the position size and planned loss so the dollar impact is clear.
Consider a 1:2 risk-to-reward opportunity: risking $100 for a possible $200 gain. The ratio describes the plan, not the expected result of any single trade. A useful written setup also states what you will do if price reaches the stop, approaches the target, or moves sideways without confirming the original idea.
Keep the rules consistent during review. If you move a stop after entry, record the reason and resulting loss separately from the original plan. If you close before the target, note the actual outcome instead of recording the trade as if it reached the target. This distinction helps you compare expected and realized performance across trades.
Before placing the next position, check whether the setup still meets its written conditions. The chart may change after entry: support can fail, resistance can shift, or price structure can weaken. Assess those changes against your defined rules rather than quietly rewriting the original plan.
Examples of high risk-reward trades
Examples make the concept easier to assess: compare the planned downside with the gain the chart structure could support. A large theoretical target matters less if the route to it is unclear or the stop does not reflect the trade thesis.
What visual chart patterns can signal asymmetric risk-reward opportunities? A pullback toward support in an uptrend, a base near a prior low, or a breakout followed by a retest can create a defined entry area. The chart is more useful when it also shows a nearby invalidation point and a farther target.
Consider a hypothetical trade risking $500 for a potential $2,000 gain. The potential reward is four times the planned loss, but the example alone says nothing about the chance of winning. A sound strategy would also define the entry condition, stop placement, target rationale, and position size before risking capital.
Another example describes 400% upside potential and 40% downside potential, a 10-to-1 relationship. That imbalance can look compelling on paper, yet the chart still needs to support where the potential gain could come from. If the target sits beyond several resistance areas, the displayed upside may overstate the practical opportunity.
Historical examples also need careful interpretation. George Soros’s bet against the Bank of England is described as risking 4% of a fund’s capital and earning over $1 billion in profits. The outcome illustrates how a trade can have substantial upside, but it doesn’t provide a template for a new position or establish its expected odds.
What are common visual-analysis mistakes when estimating a trade's potential reward? Traders may extend targets beyond visible resistance, overlook intervening price levels, or choose a stop that makes the ratio look larger. Compare the proposed path with chart structure, and include trading costs when evaluating the strategy.
How do gaps, slippage, volatility, and stop-loss execution change a trade's actual risk? A price gap can push the market beyond a stop before it executes, while slippage can result in a worse exit price than planned. Volatility can widen price swings, too, so a stop does not always cap the realized loss at the amount shown on the chart.
- Check the structure: Mark entry, invalidation, and target areas before judging the ratio.
- Separate potential from probability: A projected gain doesn’t show how often a setup wins.
- Review actual outcomes: Track losing trades and realized exits against the original plan.
For example, review a series of historical charts using the same entry and exit rules. Record each trade’s planned loss, target, and actual outcome, including any gaps or slippage. This helps show whether the visual pattern supports a repeatable strategy rather than just one unusually favorable chart.
BubbleMarkets: Free Live Market Bubble Maps
BubbleMarkets offers free live market bubble maps for scanning activity across markets. Use the Stock Market Bubble Map or Crypto Bubble Map to compare assets and spot areas for closer chart analysis. You can view the maps without an account. A bubble map helps narrow what to inspect, but it does not define an entry, stop-loss, or target. Assess those levels on the relevant chart before deciding whether a setup meets your rules.
For a broader workflow, BubbleMarkets offers Pro, Professional, and Enterprise subscriptions. The visual maps provide a market overview, while your own analysis determines whether a potential trade has defined downside and a plausible target.
Explore the Free Live Market Bubble Maps and see whether they fit your market-scanning routine.
Make Your Next Review More Consistent
Make visual analysis a repeatable review habit. For each chart, record what caught your attention, which price levels shaped your decision, and what later changed your view. Over time, these notes can help reveal whether your criteria stay consistent across market conditions.
Use market visualizations to organize what you inspect, then apply your own chart-based rules before taking action. If you’re refining how to find asymmetric risk reward trades visually, make each decision traceable: note the setup, the reason for the planned exit, and whether the actual result matched your original reasoning.
BubbleMarkets provides market-visualization tools for scanning assets and reviewing market activity. For questions about using its tools to support your market research, contact BubbleMarkets to discuss your market-visualization needs.
Keep the process clear and consistent. Each review can provide a more useful basis for your next decision.
Frequently Asked Questions
How Asymmetric Trading Works?
Asymmetric trading pairs a planned, limited loss with a larger potential gain, then evaluates the approach across repeated trades. In practice, separate records by setup type and market condition: a breakout in a rising market may behave differently from a failed breakdown in a range. Track planned and actual exits, and include trading costs. This helps show whether the strategy’s average results support its assumptions.
Does a bigger target create better risk reward?
No. A bigger target improves the potential ratio on paper only if it remains plausible and the stop still reflects where the trade idea fails. For example, a target beyond several nearby resistance areas may be less useful than a closer level supported by the chart. Compare potential targets with chart structure and historical outcomes instead of extending the target just to make the displayed ratio look larger.
What does asymmetric risk-reward mean in trading?
It means a trade’s potential gain is meaningfully larger than its defined potential loss, based on the planned entry and exit levels. Asymmetry describes the payoff structure, not the probability of success. A chart with clear room toward a target and a nearby invalidation level may offer an asymmetric profile. Its value depends on how the strategy performs across comparable trades and after costs.
Frequently asked questions
How Asymmetric Trading Works?
Asymmetric trading pairs a planned, limited loss with a larger potential gain, then evaluates the approach across repeated trades. In practice, separate records by setup type and market condition: a breakout in a rising market may behave differently from a failed breakdown in a range. Track planned and actual exits, and include trading costs. This helps show whether the strategy’s average results support its assumptions.
Does a bigger target create better risk reward?
No. A bigger target improves the potential ratio on paper only if it remains plausible and the stop still reflects where the trade idea fails. For example, a target beyond several nearby resistance areas may be less useful than a closer level supported by the chart. Compare potential targets with chart structure and historical outcomes instead of extending the target just to make the displayed ratio look larger.
What does asymmetric risk-reward mean in trading?
It means a trade’s potential gain is meaningfully larger than its defined potential loss, based on the planned entry and exit levels. Asymmetry describes the payoff structure, not the probability of success. A chart with clear room toward a target and a nearby invalidation level may offer an asymmetric profile. Its value depends on how the strategy performs across comparable trades and after costs.
Market information on this page is for education and general information only. It is not investment advice or a recommendation to buy or sell any asset.