 BubbleMarkets
Compare portfolio tools for exposure, risk, and returns

More holdings don’t automatically mean more diversification. A tool for visualizing portfolio diversification should show how direct holdings and funds combine across asset classes, sectors, and countries, alongside returns, risk, and concentration. Three interactive graphics can help make portfolio balance easier to inspect.
It is easy to focus on the number of positions or a fund’s label. The more useful question is how the underlying exposures overlap: several investments may still depend on similar markets, sectors, or companies.
This comparison explains what portfolio tools can reveal, how to read common risk and return measures, and where visualizations have limits. Learn how to compare direct investments, ETFs, and model portfolios, then use a practical decision guide to identify the views that best fit your analysis.
Key Takeaways
- Compare risk and returns over consistent periods, and read measures such as drawdown alongside performance.
- Assess individual investments, ETFs, and model portfolios using the same benchmarks and time windows.
- Break exposure down by asset class, sector, and country to see where holdings overlap.
- Look through funds to their underlying holdings to spot equity concentration hidden by a long holdings list.
- Choose visualizations that make portfolio balance easier to inspect, then use market maps to explore market movements by asset group.
Exploring risk and return allocation choices
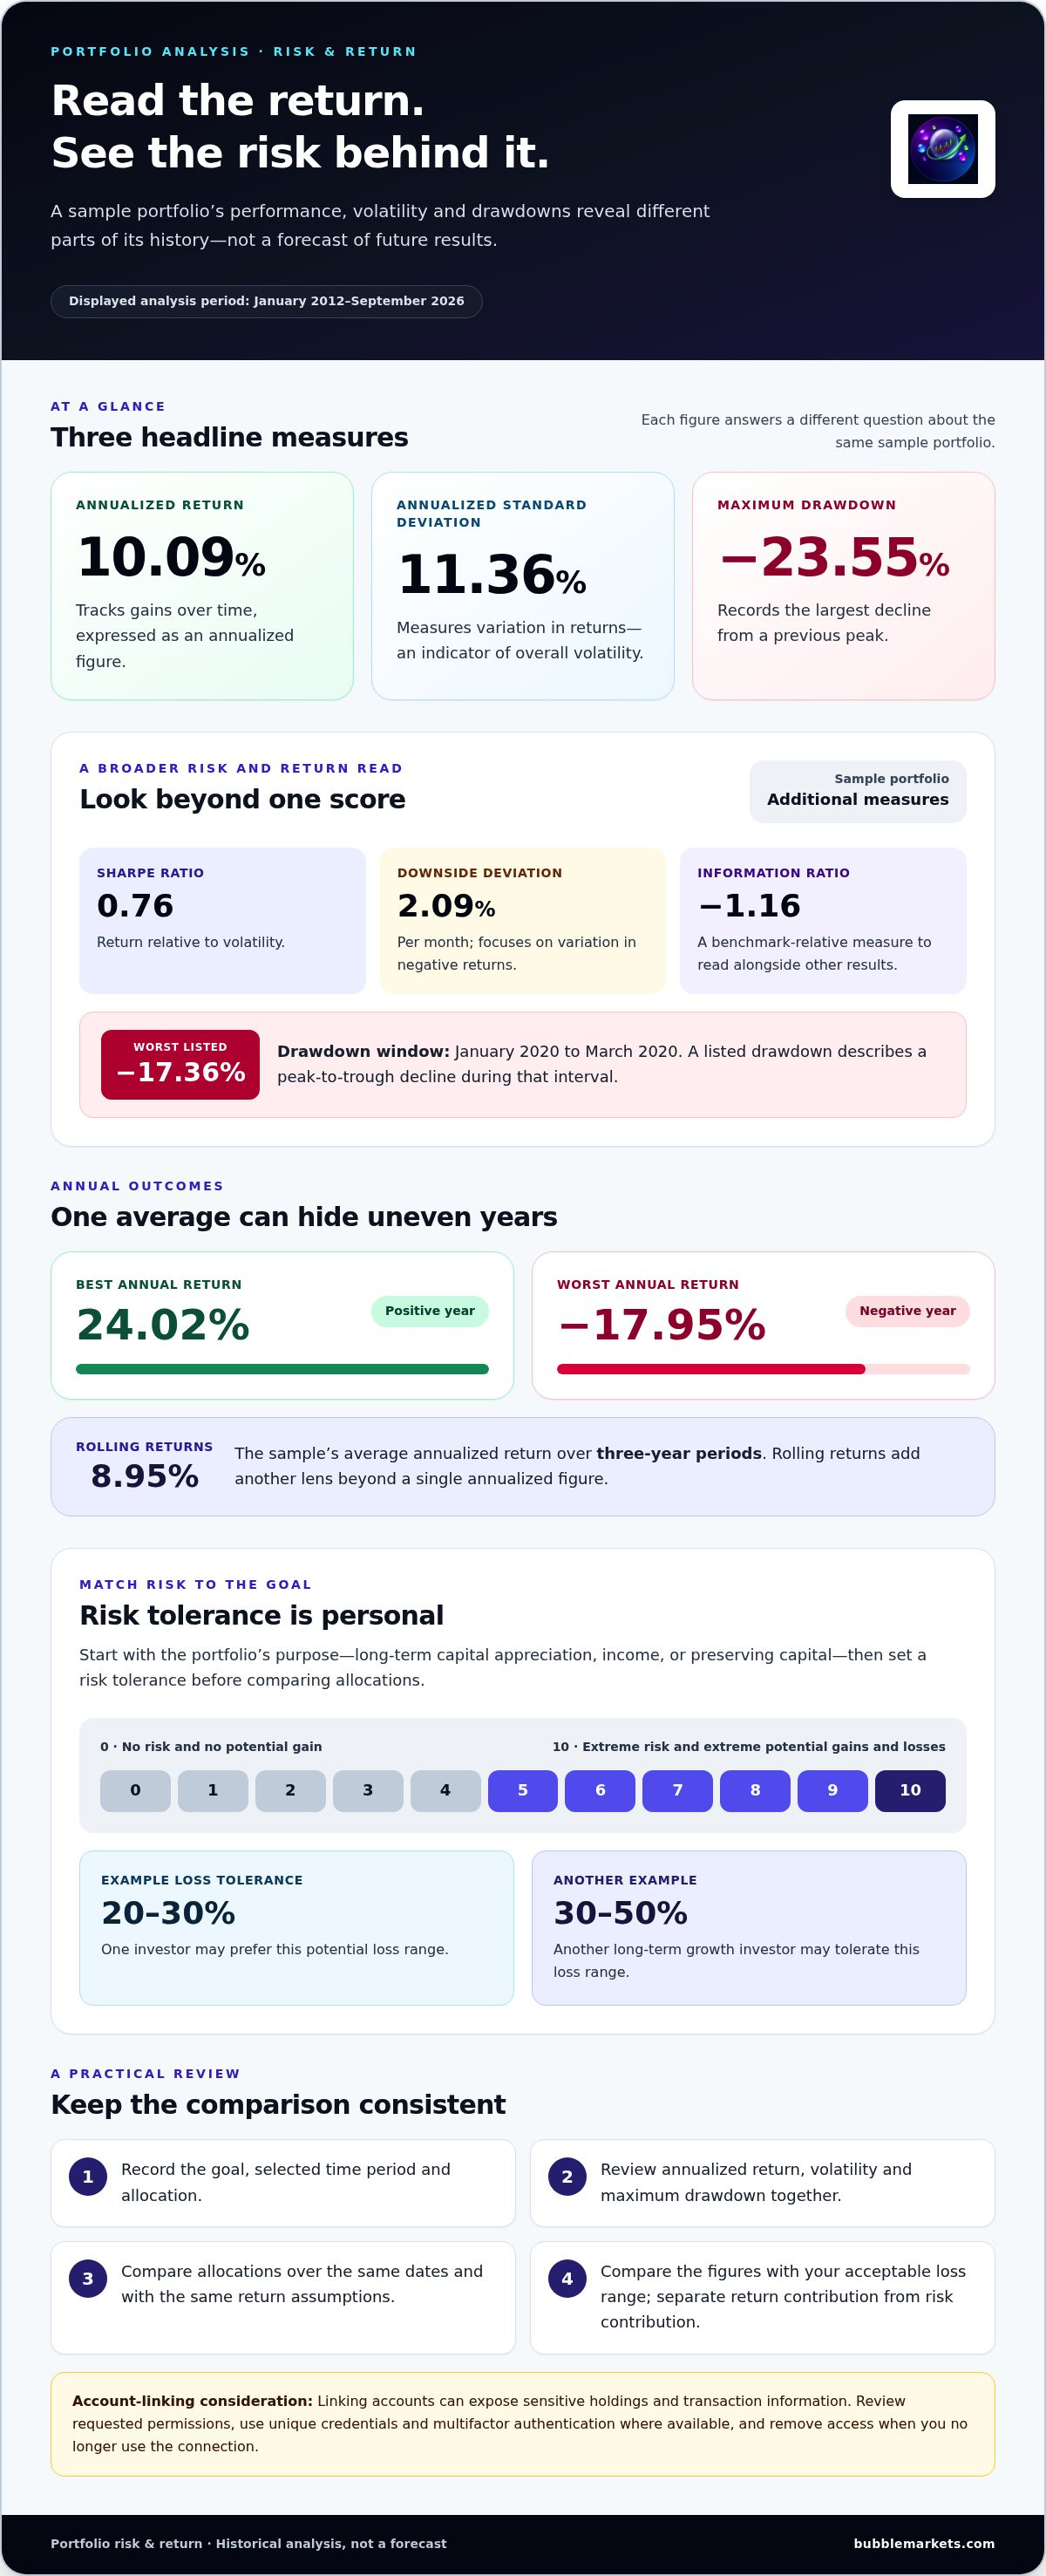
Start with the investment portfolio’s purpose: long-term capital appreciation, income, or preserving capital. Then set a risk tolerance before comparing allocations. On a 0-to-10 scale, 0 represents no risk and no potential gain; 10 represents extreme risk and extreme potential gains and losses. For long-term growth, one investor may tolerate a 30-50% loss, while another may prefer a 20-30% potential loss.
Portfolio analysis should connect the chosen allocation to both returns and losses. In one displayed analysis covering January 2012 through September 2026, the sample portfolio returned 10.09% annualized, with 11.36% annualized standard deviation. Its maximum drawdown was -23.55%. These figures describe different things: return tracks gains over time, volatility measures variation, and drawdown records a decline from a previous peak.
Use multiple metrics rather than treating one ratio as a verdict. The sample’s Sharpe ratio was 0.76, while its downside deviation was 2.09% per month. Its worst listed drawdown was -17.36% from January 2020 to March 2020. The information ratio was -1.16. Together, these measures distinguish overall fluctuation, downside movement, peak-to-trough loss, and returns relative to a benchmark.
| Analysis option | What it shows | Useful comparison |
|---|---|---|
| Annualized return | Average yearly growth | Compare portfolios over the same period |
| Standard deviation | Variation in returns | Assess overall volatility |
| Maximum drawdown | Largest peak-to-trough decline | Consider potential loss exposure |
| Sharpe ratio | Return relative to volatility | Read alongside returns and drawdowns |
| Downside deviation | Variation in negative returns | Focus on downside movement |
Choose the analysis view that matches your goal, then compare each allocation over the same dates and with the same return assumptions. A portfolio’s annualized return can hide uneven results: the sample’s best annual return was 24.02%, while its worst was -17.95%. Rolling returns add another lens; its average annualized return over three-year periods was 8.95%.
Decomposition helps explain where results come from. Separate an allocation’s return contribution from its risk contribution: a holding with a large weight may drive more of the portfolio’s movement, while assets that move differently may change overall risk. Review weights, historical performance, and downside measures together before deciding whether an allocation fits its intended goal.
Linking accounts can expose sensitive holdings and transaction information to a tool, creating risks if access credentials or stored data are compromised. Review requested permissions, use unique credentials and multifactor authentication where available, and remove access when you no longer use the connection.
For a practical review, record the goal, selected time period, allocation, annualized return, volatility, and maximum drawdown. Compare those figures with your acceptable loss range. This step-by-step analysis makes trade-offs visible without treating past performance as a prediction of future results.
Comparing investments, ETFs, stocks, and model portfolios
Compare each strategy against the same benchmark, dates, and return period. A stock’s gain alone will not show whether it outperformed its market, while an ETF’s return may reflect broad exposure rather than a single company. Model portfolios offer another comparison: they show how a chosen mix of investments performed together.
For a displayed analysis from January 2012 through September 2026, a sample portfolio had a 14.99% annualized return against its State Street SPDR S&P 500 ETF benchmark. The sample’s annualized return was 10.09%, and its correlation with the benchmark was 0.96. Its annualized beta was 0.79, indicating that its historical movement differed in scale from the benchmark. Compare correlation, beta, and returns together; none explains the full relationship alone.
Ending balances make the same comparison tangible. Starting from $10,000, the sample portfolio ended at $41,278, while the benchmark ended at $78,477 over the displayed period. These results describe that historical interval, not a forecast. Keep the start date, end date, and reinvestment assumptions consistent when comparing a stock, an ETF, and a model strategy.
Model portfolio comparisons can also reveal how different allocations behave across shorter windows. The Mebane Faber Ivy Portfolio showed a 18.11% YTD return, a 17.91% 1-year return, and a 15.27% 3-year return. The Bogleheads Three Funds portfolio showed 9.96% YTD, 12.92% over 1 year, and 18.17% over 3 years. These windows can rank portfolios differently, so match them to your review period.
To assess overlap across ETFs and mutual funds, use portfolio analysis tools that look through funds to their underlying holdings and compare shared securities or sector weights. According to the U.S. Government Publishing Office, typical mutual funds disclose their holdings quarterly, which can affect how current an overlap view is.
| Comparison | What to inspect | Why it matters |
|---|---|---|
| Individual stocks | Return, volatility, and benchmark relationship | Separates company-specific performance from market movement |
| ETFs and mutual funds | Underlying holdings and exposure overlap | Shows whether funds repeat similar positions |
| Model portfolios | Allocation and matching return windows | Compares strategies on consistent terms |
Choose the comparison based on your question: use benchmark-relative metrics for performance, fund look-through for overlap, and matched periods for strategy comparisons. To add a visual view of stock movements across markets, explore stock market maps alongside portfolio analysis.
Portfolio exposure breakdowns by asset class, sector, and country
Exposure views show how an investment portfolio is allocated and which markets shape its results. Compare asset-class, sector, and country views to see different layers of concentration.
Asset Class Exposure
Asset class exposure groups holdings by investment type, such as stocks, real estate, international equities, and bonds. Consider a portfolio with 48.00% in Vanguard MStar Total Stk Mkt ETF (VTI), 8.00% in Vanguard Real Estate ETF (VNQ), 24.00% in Vanguard Total International Stock ETF (VXUS), and 20.00% in Vanguard Total Bond Market ETF (BND). This view shows broad allocation; it doesn’t reveal which industries or countries drive each fund’s underlying exposure.
Sector and Country Exposure
Sector exposure organizes holdings by business activity, while country exposure groups them by geographic market. These views can uncover concentration hidden by an asset-class chart: VTI and VXUS are both equity funds, but their country and sector allocations may differ. Examine each category’s portfolio weight, then compare large exposures across direct stocks and funds. This makes it easier to identify holdings with similar market drivers.
Asset Coverage and Diversification
Asset coverage describes which investment types and markets a visualizer can classify, including direct holdings and funds. A broad asset-class view helps compare stocks, international equities, real estate, and bonds, while sector and country breakdowns add detail. Check whether each holding appears in these views. Unclassified positions can distort the apparent balance, and a long holdings list can still contain overlapping exposures.
Asset-level performance and correlations add context to allocation charts. Compare how each holding moved over the same period, then examine whether two exposures tend to move together. A country breakdown can reveal geographic spread, while a correlation view can show whether those markets have behaved similarly. Correlation describes historical co-movement; it does not establish that exposures will continue to move together.
Use a repeatable review sequence to interpret the visualization:
- Group positions by asset class and inspect the portfolio weights.
- Break equity exposure into sectors and countries.
- Look through funds to identify repeated industries, markets, or underlying holdings.
- Compare asset-level performance and correlations over a consistent period.
A useful feature is the ability to switch between these views without changing the portfolio being analyzed. Start with broad asset allocation, then inspect sector and country details where one category dominates. In the example allocation, VXUS creates international equity exposure, while BND adds bonds; the sector and country views explain what those broad labels contain.
| View | Shows | Use it to |
|---|---|---|
| Asset class | Stocks, real estate, international equities, bonds | Review broad allocation |
| Sector | Business activity across equity holdings | Spot industry concentration |
| Country | Geographic market exposure | Inspect regional distribution |
Choose the view that answers your current question: asset class for broad balance, sector for industry concentration, or country for geographic exposure. Then use performance and correlation comparisons to assess how those allocations have behaved together.
Equity concentration through direct holdings and funds
A portfolio can hold several funds and still depend heavily on the same companies. Check direct stock positions alongside each fund’s underlying holdings. If a company appears both as a direct holding and inside an equity fund, its combined portfolio weight exceeds the direct position alone. A look-through view helps reveal that overlap and gives a clearer picture of equity concentration.
Start by consolidating holdings by company rather than treating every fund as a separate exposure. Then compare each company’s direct position with its weighted contribution through funds. The Vanguard MStar Total Stk Mkt ETF (VTI) and Vanguard Total International Stock ETF (VXUS) illustrate why fund names alone are insufficient: inspect underlying holdings and country exposure before assessing their combined contribution.
Use the same valuation date for direct securities and fund holdings. If dates differ, market movements or updated fund disclosures can make the combined view less consistent. A portfolio tracking tool can help monitor position changes over time; alerts can flag price movements that may shift the balance. Treat an alert as a prompt to review exposure, not as an assessment of whether a position is suitable.
- Group direct stocks and fund holdings by company.
- Calculate each company’s combined weight across direct and indirect positions.
- Sort the consolidated view by exposure to find the largest concentrations.
- Compare sector and country labels to identify overlapping sources of equity exposure.
Consider how the display handles incomplete or changing holdings data. Mutual funds typically disclose holdings quarterly, according to the U.S. Government Publishing Office, so a fund-based view may reflect a reporting date rather than its current portfolio. Fund holdings can also change between disclosures. Keep the date attached to each position visible when reviewing apparent overlap.
Backtesting can show how a past allocation behaved across historical market conditions. It simulates an investment strategy using historical data, helping compare the effects of different weights or combinations. It cannot reveal a fund’s exact future holdings or establish that historical concentration will produce the same results again. Use backtesting to inspect scenarios, not to replace a current holdings breakdown.
For a practical concentration review, compare the consolidated company list with fund-level and sector-level views. If a direct stock and a fund both contribute to the same company or industry, note the combined exposure before treating the number of positions as evidence of balance. Repeat the comparison after holdings updates or allocation changes to see whether concentration has shifted.
The useful output is a traceable view: direct position, fund contribution, combined company exposure, and the date of each underlying holding. That structure helps distinguish a genuinely broader set of exposures from repeated ownership through different wrappers. Review these details alongside asset-class, country, and sector views to understand where equity concentration sits within the wider portfolio.
Portfolio diversification visualization
A tool for visualizing portfolio diversification should connect actual holdings to useful views, not treat a long asset list as proof of balance. Compare allocation, concentration, and performance separately because each view answers a different question. One portfolio analysis describes three interactive graphics for depicting portfolio balance. Read the graphics together, then inspect the positions behind them.
Which portfolio visualization tools support manual entry and spreadsheet uploads? Some tools let you enter positions manually or import a spreadsheet with identifiers and position details. After entry, compare the displayed holdings with your own records to catch missing or duplicated positions before interpreting the charts.
How do I connect brokerage accounts or import holdings into a portfolio visualization tool? Use an available account connection or import holdings from a spreadsheet, then review the imported positions against your brokerage records. Confirm that cash, funds, and direct securities appear in the correct categories before relying on the resulting allocation view.
How accurate and frequently updated are portfolio diversification visualizations? Accuracy depends on the holdings entered, valuation data, classification, and update timing. According to the U.S. Government Publishing Office, typical mutual funds disclose holdings quarterly, so underlying fund positions may reflect the latest disclosure rather than current holdings. Price updates and holdings updates are separate; note the date shown for each view.
Use the graphics in sequence, not as a single score. Start with allocation to see broad asset-class weights, then inspect sector or country views for concentrations. A bond allocation identifies an asset class, but the label alone does not describe the issuers or credit exposure inside a fund. Compare these views with the actual positions they represent.
- Choose manual entry or spreadsheet import based on how you maintain records.
- Confirm that each holding appears once and has the correct category and value.
- Review holdings dates separately from price-data dates.
- Treat chart-based recommendations as prompts for further analysis, not personalized investment advice.
Backtesting adds historical context by simulating a strategy with past data. It answers a different question from a current holdings view: historical allocation shows how a scenario behaved, while current positions show present exposure. A tool for visualizing portfolio diversification can help organize those views, but data dates and inputs still shape what the charts display.
For a practical review, choose one graphic for allocation, one for concentration, and one for performance or risk. Record the date and input method beside each result so later updates are easier to compare. A tool for visualizing portfolio diversification is most useful when you can trace a chart back to its inputs. Explore portfolio tracking and price alerts to follow holdings and price movements.
BubbleMarkets: Free Live Market Bubble Maps
BubbleMarkets offers free, live market bubble maps for readers who want to view market movements alongside portfolio analysis. The maps complement holdings-level review: use them to scan market categories, then return to your own allocation and concentration data to assess portfolio exposure.
The Stock Market Bubble Map and Crypto Bubble Map focus on distinct asset groups. They can help you explore how market-wide movements differ across stocks and crypto, without treating a market map as a personalized portfolio recommendation or a replacement for risk analysis.
Start with the free maps to explore the visual format. Pro, Professional, and Enterprise subscriptions offer additional options. For a market-level visual to use alongside your portfolio review, visit bubblemarkets.com.
Make Your Next Portfolio Review More Deliberate
Turn your next review into a repeatable decision process. First, choose the question: are you checking exposure, tracking a change, or comparing a market view with your own holdings? Then record the view and review date so you can compare later without relying on memory. A tool for visualizing portfolio diversification is most useful when its charts help answer a clear question, not trigger an automatic decision.
For market context, BubbleMarkets’ free live market bubble maps include the Stock Market Bubble Map. Pro, Professional, and Enterprise subscriptions are also available. Use a market visualization to explore movement, then assess your own portfolio separately. The map provides a market view, not personalized investment recommendations.
If you want to explore BubbleMarkets’ visual tools or discuss your portfolio, contact BubbleMarkets. Start with one question, inspect the relevant view, and make your next review easier to compare.
Frequently Asked Questions
How does my portfolio look?
Assess diversification by comparing your actual exposures with the balance you intend to maintain. A portfolio with several funds may still rely heavily on a small group of companies if those funds own the same shares. Review issuer weights and sector exposure, then check whether any large position changes the portfolio’s overall risk profile. Repeat the review after deposits, withdrawals, or substantial price movements.
Why does diversification matter?
Diversification spreads exposure across investments with different sources of risk. If one company or industry weakens, other holdings may respond differently, affecting the portfolio’s overall movement. Diversification does not remove risk or ensure a return. Adding international assets changes geographic exposure, while adding bonds changes the mix of asset types. Consider how each position contributes to the portfolio rather than counting holdings alone.
What tools visualize portfolio diversification and asset allocation?
A tool for visualizing portfolio diversification can organize positions into allocation charts, exposure breakdowns, and performance views. For a useful comparison, look for coverage of both direct securities and funds, plus categories such as asset class, sector, and country. A holdings table can help explain chart totals. Market maps show movements across markets, while a portfolio view focuses on the positions and weights included in your account.
How do portfolio visualization tools calculate asset allocation by sector and asset class?
A tool for visualizing portfolio diversification typically groups positions using their recorded values and classifications, then calculates each group’s share of the portfolio total. A fund may be classified by its underlying holdings rather than just its name. For example, one fund can contribute to several sectors. Review the tool’s classifications and input dates, especially when a holding spans multiple industries or markets.
Can portfolio tools visualize geographic diversification and currency exposure?
Some portfolio tools show country exposure and currency exposure as separate classifications. Country views can help identify the geographic associations of issuers or investments; currency views show which currencies may affect reported values or cash flows. An international fund, for example, can hold companies across several countries while having exposure to a narrower set of currencies. Review the classification method and underlying positions to interpret both views correctly.
Frequently asked questions
How does my portfolio look?
Assess diversification by comparing your actual exposures with the balance you intend to maintain. A portfolio with several funds may still rely heavily on a small group of companies if those funds own the same shares. Review issuer weights and sector exposure, then check whether any large position changes the portfolio’s overall risk profile. Repeat the review after deposits, withdrawals, or substantial price movements.
Why does diversification matter?
Diversification spreads exposure across investments with different sources of risk. If one company or industry weakens, other holdings may respond differently, affecting the portfolio’s overall movement. Diversification does not remove risk or ensure a return. Adding international assets changes geographic exposure, while adding bonds changes the mix of asset types. Consider how each position contributes to the portfolio rather than counting holdings alone.
What tools visualize portfolio diversification and asset allocation?
A tool for visualizing portfolio diversification can organize positions into allocation charts, exposure breakdowns, and performance views. For a useful comparison, look for coverage of both direct securities and funds, plus categories such as asset class, sector, and country. A holdings table can help explain chart totals. Market maps show movements across markets, while a portfolio view focuses on the positions and weights included in your account.
How do portfolio visualization tools calculate asset allocation by sector and asset class?
A tool for visualizing portfolio diversification typically groups positions using their recorded values and classifications, then calculates each group’s share of the portfolio total. A fund may be classified by its underlying holdings rather than just its name. For example, one fund can contribute to several sectors. Review the tool’s classifications and input dates, especially when a holding spans multiple industries or markets.
Can portfolio tools visualize geographic diversification and currency exposure?
Some portfolio tools show country exposure and currency exposure as separate classifications. Country views can help identify the geographic associations of issuers or investments; currency views show which currencies may affect reported values or cash flows. An international fund, for example, can hold companies across several countries while having exposure to a narrower set of currencies. Review the classification method and underlying positions to interpret both views correctly.
Market information on this page is for education and general information only. It is not investment advice or a recommendation to buy or sell any asset.