 BubbleMarkets
Crypto Bubble Map: How to Read Crypto Market Moves in 2026

What if the biggest bubble on a crypto dashboard tells you less than you think? A crypto bubble map makes market moves easier to scan, but size and color only have meaning once you check the legend. A striking pattern shows how data is arranged, not whether an asset is overvalued or where its price will go.
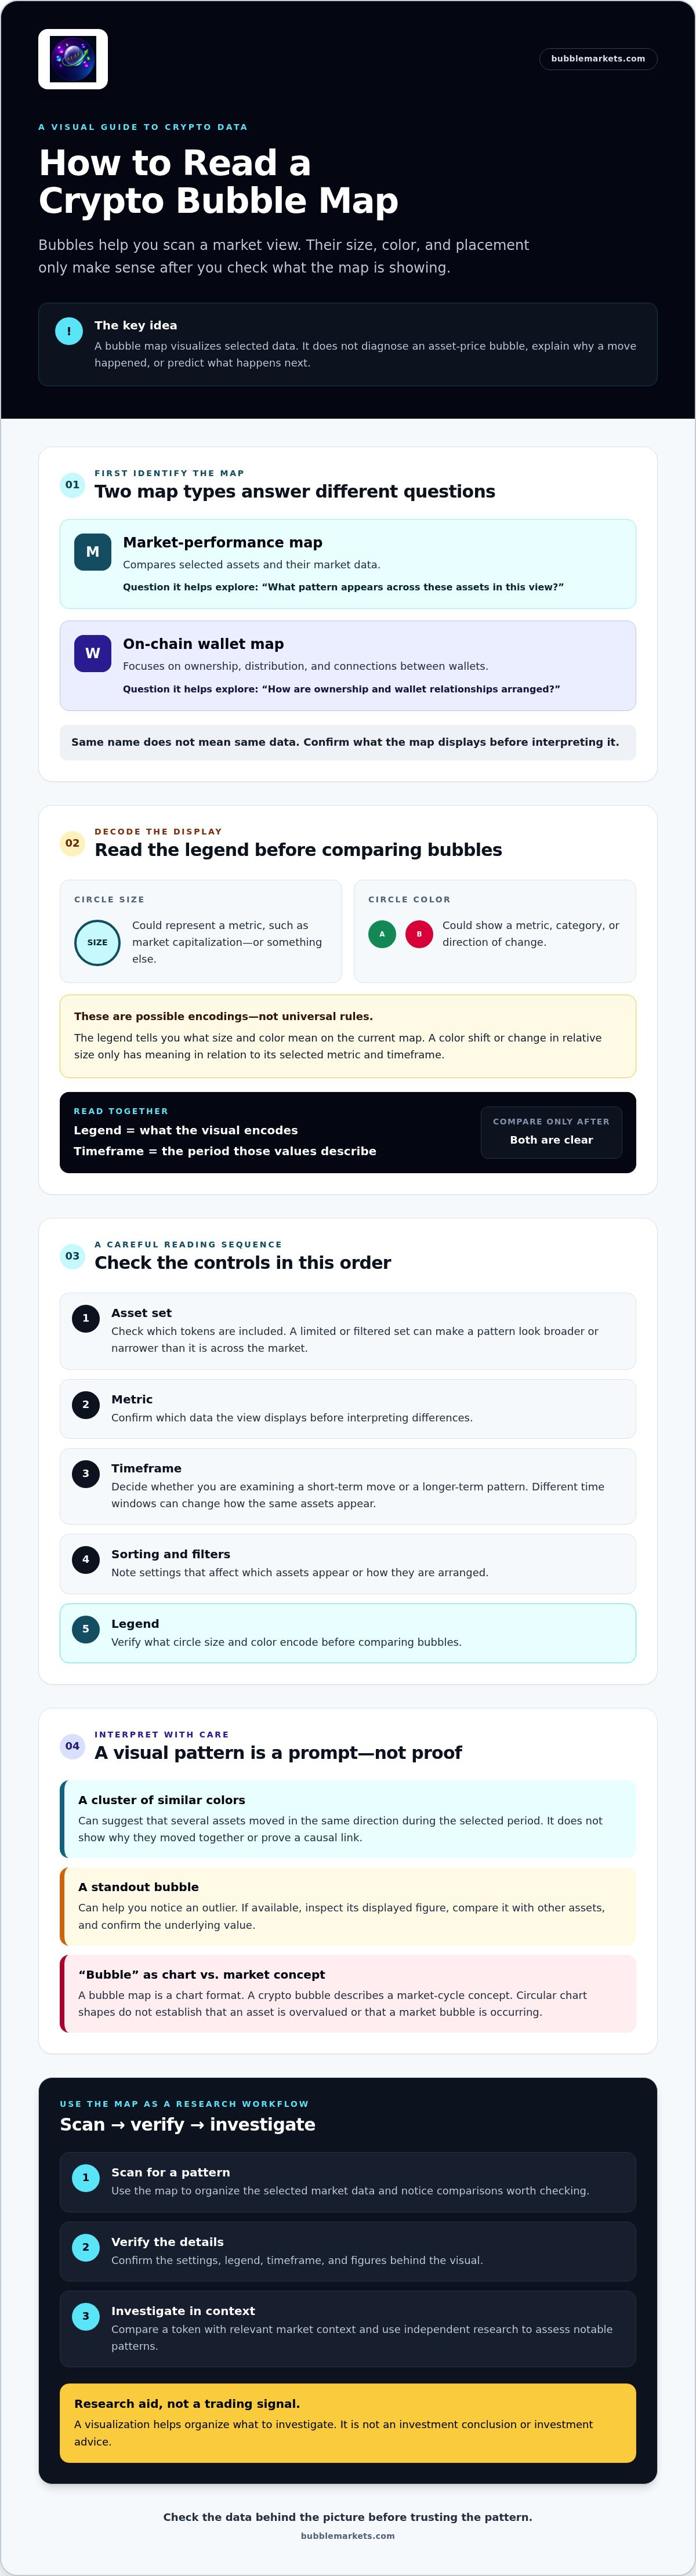
Two tools can use the same name while showing different information. Market-performance maps compare selected assets and their market data. On-chain wallet maps focus on ownership, distribution, and connections between wallets. They answer different questions, so first identify what data the map displays.
This guide explains how to read visual signals, distinguish market maps from wallet maps, and understand the limits of each view. You’ll learn what to check before interpreting bubble size, color, or grouping, and how to use a crypto bubble map to guide further research, not reach an investment conclusion.
Key Takeaways
- Choose assets, a metric, a timeframe, and filters that match the question you’re investigating.
- Before comparing bubbles, check the legend to confirm what their size and color represent.
- Use a crypto bubble map to scan asset-level market data; use an on-chain wallet map to explore ownership and wallet relationships.
- Compare a token with relevant market context, then verify notable patterns with independent research.
- Treat visualizations as a way to organize research, not as trading signals or investment advice.
What Is a Crypto Bubble Map, and What Does It Actually Show?
A crypto bubble map arranges multiple crypto assets as circles so you can scan selected data across a market view. Depending on the map’s configuration, each circle may represent one asset. Its position, size, and color can encode different information, so don’t assume every tool uses the same visual rules.
Use the map to spot patterns worth checking, such as several assets showing similar movement under the selected settings. The visualization summarizes the data it displays. It doesn’t explain why a change occurred or establish whether an asset is fairly valued.
What Do the Bubbles, Sizes, and Colors Represent?
Start with the legend. It explains what each visual feature means, including whether circle size or color corresponds to a metric, category, or direction of change. A map might use size for a measure such as market capitalization and color for positive or negative performance. Those are possible encodings, not assumptions: check the current map interface before interpreting a metric.
Next, check the timeframe. A map set to a shorter period may look different from one set to a longer period, even when the assets and other settings are unchanged. A color shift or change in relative circle size only means something in relation to the selected metric and time window. Confirm both before comparing assets or describing a pattern.
A Market Bubble Map Is Not the Same as a Crypto Bubble
The word “bubble” has two meanings here. A bubble map is a chart format; a crypto bubble is a market-cycle concept, typically associated with prices rising beyond levels supported by underlying conditions and later falling. The history of cryptocurrency bubbles provides context for that market phenomenon, but a chart’s circular layout is not evidence that one is occurring.
A map can display gains or losses in its chosen data without showing whether prices are overvalued. It also can’t predict what happens next. Use it to identify a movement or comparison to investigate, then assess that observation alongside other relevant information.
A bubble map visualizes selected market data; it does not diagnose an asset-price bubble or provide an investment conclusion. Treat the display as a scanning tool, not a verdict.
How to Read a Crypto Bubble Map Without Misreading Its Signals
Check the controls before interpreting the pattern. A crypto bubble map can help you scan assets quickly, but comparisons only make sense when you know which assets and data the view includes. Use this sequence when the map provides these options:
- Choose the asset set: Check which tokens are included. A filtered or limited set can make a pattern appear broader or narrower than it is across the market.
- Identify the metric: Confirm what data the view displays before interpreting differences.
- Set the timeframe: Decide whether you’re examining a short-term move or a longer-term pattern.
- Review sorting and filters: Note settings that affect which assets appear or how they’re arranged.
- Check the legend: Verify what circle size and color encode before comparing bubbles.
Start With the Legend, Asset Set, and Timeframe
The asset universe defines the comparison: a view limited to selected tokens answers a different question from one covering a broader set. A short timeframe helps you examine recent movement; a longer one can show whether that movement sits within a wider trend. Neither view tells the whole story. Check the current interface for available assets, metrics, timeframes, and filters rather than assuming every map offers the same settings.
Read the legend and timeframe together: the legend explains what the visual encodes, while the timeframe defines the period those values describe.
Use Color and Size as Prompts for Further Inspection
Visual contrast helps direct your attention, but it doesn’t settle a question. A large bubble might represent a larger value for the selected metric, or its size may encode something else. A strong color might indicate a direction or category, but its meaning depends on the legend. If the map allows it, hover over or select an outlier. Compare its displayed figure with other assets and confirm the underlying value before drawing conclusions.
A cluster of similarly colored bubbles can suggest that several assets moved in the same direction during the selected period. It doesn’t show why they moved together or establish a causal link. Check the figures and relevant market context, then use independent research to assess what the pattern may mean. Fidelity’s guide to how to evaluate a cryptocurrency offers additional factors to consider beyond a visual comparison.
For a practical first scan, explore BubbleMarkets’ crypto market map. Check the available legend and controls before interpreting what it displays.
Crypto Market Bubble Map vs. On-Chain Wallet Map: Which One Answers Your Question?
The term “crypto bubble map” can describe two different kinds of visualization. One compares assets and their market data; the other maps relationships between blockchain addresses. Choose based on your question: how are selected tokens performing, or how are wallets connected on-chain?
| Map type | What it represents | Typical inputs | Questions it can help explore |
|---|---|---|---|
| Market-performance map | Assets and selected market data | Metrics shown by the selected tool, such as price movement or market capitalization if available | Which assets stand out under a chosen metric and timeframe? |
| On-chain wallet map | Blockchain addresses and observed relationships | Address activity and transaction links, depending on the tool | Which wallets appear connected through recorded activity? |
Market-Performance Maps: Comparing Assets at a Glance
A market map presents asset-level data in one visual, helping you notice which tokens warrant a closer look. Metrics vary by tool, so check its legend and asset details rather than assuming it displays price change, market capitalization, or trading volume. A visual comparison can help narrow your research list, but it can’t explain what caused a move. For additional chart-reading context, see Fidelity’s guide to how to read crypto charts.
On-Chain Bubble Maps: Exploring Wallet Relationships
Wallet-cluster tools focus on addresses and relationships recorded on a blockchain, rather than comparing market performance across tokens. Bubblemaps is one third-party example of this type of on-chain analysis. Depending on the tool and data shown, a visualization may help you examine links between addresses or trace activity for further investigation.
Interpret those links cautiously. A recorded transaction relationship doesn’t, by itself, prove that addresses share an owner, coordinate their actions, or indicate insider activity or manipulation. The map shows relationships according to its data and method; establishing meaning requires additional context and research.
Neither map type is universally better. Use a market-performance map to compare selected assets, or an on-chain wallet map to investigate address activity. Neither visualization alone confirms manipulation or predicts future prices. Let your question guide the choice, then verify any pattern before reaching a conclusion.
A Practical Crypto Bubble Map Workflow for More Careful Research
Use the map to form a question, then check whether the underlying data supports what you noticed. A repeatable process also makes it easier to revisit an observation without relying on memory.
- Start broad: Scan the selected asset set and note unusual size, color, or grouping.
- Check the encoding: Read the legend and identify the metric represented by each visual feature.
- Confirm the timeframe: Record the period shown, since a pattern may differ across short and long views.
- Inspect the figures: Check the displayed values for the assets that caught your attention.
- Add context: Compare with relevant assets or broader market data, then consult independent research before interpreting the move.
Keep a brief record of the asset set, metric, timeframe, and filters used. When you return to the map, those settings help distinguish a changed pattern from a changed view.
Move From a Visual Pattern to a Verifiable Question
Describe what you see without assuming why it happened. For example, turn “this token is being pushed” into “what data explains this token’s movement relative to the selected assets during this period?” Then verify the figures and check relevant context. Appearance alone doesn’t establish a cause, coordinated activity, or future performance.
Compare the token with relevant market context instead of treating it as an isolated signal. A move may look unusual within a small asset set but less distinctive against a broader comparison. The goal is to refine the question, not to make the map answer more than its data can support.
Use Multiple Views Without Treating Them as Independent Proof
If the tool supports it, compare related assets or timeframes to see whether an observation persists. Keep in mind that multiple views may rely on overlapping underlying data. Seeing a similar pattern more than once can guide further research, but it isn’t independent confirmation by itself.
For broader guidance on visual market scanning, read the complete market bubble map guide. You can also explore BubbleMarkets’ market bubble maps as a visual starting point, then verify notable observations against relevant data and research.
This workflow is for educational purposes only. It isn’t personalized investment advice, and a map pattern isn’t a trading signal.
Explore Crypto Market Data With BubbleMarkets’ Crypto Bubble Map
BubbleMarkets’ crypto bubble map is a visual scanning tool for reviewing selected crypto market data in one view. Use the legend and controls to identify what the current display represents, then note assets or patterns to examine more closely. The map is a starting point for research, not a trading signal or a conclusion about an asset’s value.
BubbleMarkets provides free live market visualizers across several asset categories, including crypto, stocks, ETFs, commodities, bonds, and forex. Metrics, asset coverage, timeframe options, and data freshness can vary by map, so check the current interface rather than assuming a particular setting or update interval.
When a Visual Market Tool Fits Your Research Process
A market map can help when you want to scan multiple assets before opening individual data views. For example, use the visual to identify tokens that merit a closer look, then review their underlying figures and relevant market context. The map helps organize that first pass; it doesn’t explain why an asset moved or predict what happens next.
BubbleMarkets also offers optional subscription capabilities, including market screening, portfolio tracking, price alerts, and AI-generated market summaries. These features may suit readers who want more ways to organize market information, but they aren’t required to use a visual map. None should be treated as a guaranteed signal.
Explore the Map and Continue With Your Own Analysis
Before interpreting a pattern, inspect the current legend, timeframe, and asset coverage. Note what bubble size and color represent, then check any values that stand out. If you return to the map later, keeping track of the settings you used can help you make a fair comparison.
BubbleMarkets is a data visualization platform, not a broker, financial adviser, or trade-execution service. Its visualizations don’t provide personalized investment recommendations. Use them to guide further research, and consult other relevant information before reaching your own conclusions.
To try this approach, explore the live crypto bubble map. Check its current controls first, then use any pattern you notice as a prompt for independent analysis.
Make Your Next Market Scan More Deliberate
A crypto bubble map helps you compare selected assets quickly, but its signals depend on the metric, timeframe, and legend. Market-performance maps show asset-level data; on-chain maps explore wallet relationships. Neither type proves why a pattern appeared or predicts what comes next.
Use the visual to frame a question, verify the underlying figures, and compare relevant market context before drawing conclusions. BubbleMarkets provides free live market visualizers across crypto and other asset classes, including stocks, ETFs, commodities, bonds, and forex. These are data visualization tools, not brokerage, trading, or advisory services.
Ready to put the method into practice? Explore the crypto bubble map, check its current legend and settings, and use what you notice as a starting point for your own research. A careful scan can make the next step clearer.
Frequently Asked Questions
What is a crypto bubble map?
A crypto bubble map is a visual layout for scanning multiple crypto assets and selected data at once. Depending on the tool, each circle may represent an asset, while its size, color, or position can encode information described in the map’s legend. The display helps organize comparisons, but it doesn’t diagnose a market bubble, explain why prices moved, or predict future performance.
How do you read a crypto bubble map?
Start by checking which assets are included, then identify the metric and timeframe. Read the legend to confirm what circle size and color mean before comparing tokens. If a bubble stands out, inspect its underlying value and compare it with relevant market context. The same visual can tell a different story under another metric or timeframe, so record the settings used for your observation.
Does a crypto bubble map show whether a coin is overvalued?
No. A map displays selected data, such as a metric or price movement if the tool includes it, but that view alone can’t establish whether an asset is overvalued. A large bubble or strong color is a visual cue, not a valuation conclusion. To assess what a pattern may mean, check the displayed figures and consider other relevant information, including factors specific to the asset.
What is the difference between a crypto bubble map and an on-chain bubble map?
A market-performance bubble map compares assets using selected market data. An on-chain bubble map focuses on blockchain addresses and relationships observed through transaction activity. The first can help you scan token-level patterns; the second can help explore wallet connections. Wallet links don’t by themselves prove common ownership, intent, or manipulation, and neither type of visualization alone confirms a cause or predicts price direction.
Can a crypto bubble map help identify trading opportunities?
A crypto bubble map can help you spot assets or patterns to research, but it doesn’t provide trading signals or personalized investment recommendations. Treat an unusual bubble as a prompt: verify the metric, timeframe, and underlying figures, then investigate relevant market context independently. A visual comparison can help organize your research, but it can’t establish that an opportunity is suitable or indicate what an asset will do next.
Are crypto bubble maps updated in real time?
Update timing depends on the specific map and its data source, so don’t assume every display refreshes in real time. Check the tool’s interface or documentation for its stated data freshness and any relevant timestamp. BubbleMarkets offers free live market visualizers, but confirm the freshness and metrics for a particular map in its current interface before relying on the display.
Are crypto bubble maps and crypto heat maps the same?
They’re related visual tools, but the terms don’t guarantee the same layout or encoding. A bubble map uses circles, with size and color meanings defined by its legend. A heat map commonly uses colored cells or tiles to represent data across assets. Both can support broad market scanning. Check each tool’s legend, metric, and timeframe before comparing displays or interpreting a color as a particular value.
Frequently asked questions
What Do the Bubbles, Sizes, and Colors Represent?
Start with the legend. It explains what each visual feature means, including whether circle size or color corresponds to a metric, category, or direction of change. A map might use size for a measure such as market capitalization and color for positive or negative performance. Those are possible encodings, not assumptions: check the current map interface before interpreting a metric. Next, check the timeframe. A map set to a shorter period may look different from one set to a longer period, even when the assets and other settings are unchanged. A color shift or change in relative circle size only means something in relation to the selected metric and time window. Confirm both before comparing assets or describing a pattern.
What is a crypto bubble map?
A crypto bubble map is a visual layout for scanning multiple crypto assets and selected data at once. Depending on the tool, each circle may represent an asset, while its size, color, or position can encode information described in the map’s legend. The display helps organize comparisons, but it doesn’t diagnose a market bubble, explain why prices moved, or predict future performance.
How do you read a crypto bubble map?
Start by checking which assets are included, then identify the metric and timeframe. Read the legend to confirm what circle size and color mean before comparing tokens. If a bubble stands out, inspect its underlying value and compare it with relevant market context. The same visual can tell a different story under another metric or timeframe, so record the settings used for your observation.
Does a crypto bubble map show whether a coin is overvalued?
No. A map displays selected data, such as a metric or price movement if the tool includes it, but that view alone can’t establish whether an asset is overvalued. A large bubble or strong color is a visual cue, not a valuation conclusion. To assess what a pattern may mean, check the displayed figures and consider other relevant information, including factors specific to the asset.
What is the difference between a crypto bubble map and an on-chain bubble map?
A market-performance bubble map compares assets using selected market data. An on-chain bubble map focuses on blockchain addresses and relationships observed through transaction activity. The first can help you scan token-level patterns; the second can help explore wallet connections. Wallet links don’t by themselves prove common ownership, intent, or manipulation, and neither type of visualization alone confirms a cause or predicts price direction.
Can a crypto bubble map help identify trading opportunities?
A crypto bubble map can help you spot assets or patterns to research, but it doesn’t provide trading signals or personalized investment recommendations. Treat an unusual bubble as a prompt: verify the metric, timeframe, and underlying figures, then investigate relevant market context independently. A visual comparison can help organize your research, but it can’t establish that an opportunity is suitable or indicate what an asset will do next.
Are crypto bubble maps updated in real time?
Update timing depends on the specific map and its data source, so don’t assume every display refreshes in real time. Check the tool’s interface or documentation for its stated data freshness and any relevant timestamp. BubbleMarkets offers free live market visualizers, but confirm the freshness and metrics for a particular map in its current interface before relying on the display.
Are crypto bubble maps and crypto heat maps the same?
They’re related visual tools, but the terms don’t guarantee the same layout or encoding. A bubble map uses circles, with size and color meanings defined by its legend. A heat map commonly uses colored cells or tiles to represent data across assets. Both can support broad market scanning. Check each tool’s legend, metric, and timeframe before comparing displays or interpreting a color as a particular value.
Market information on this page is for education and general information only. It is not investment advice or a recommendation to buy or sell any asset.