 BubbleMarkets
Cryptobubbles vs Bubble Map: Understand Size, Rotation and Risk
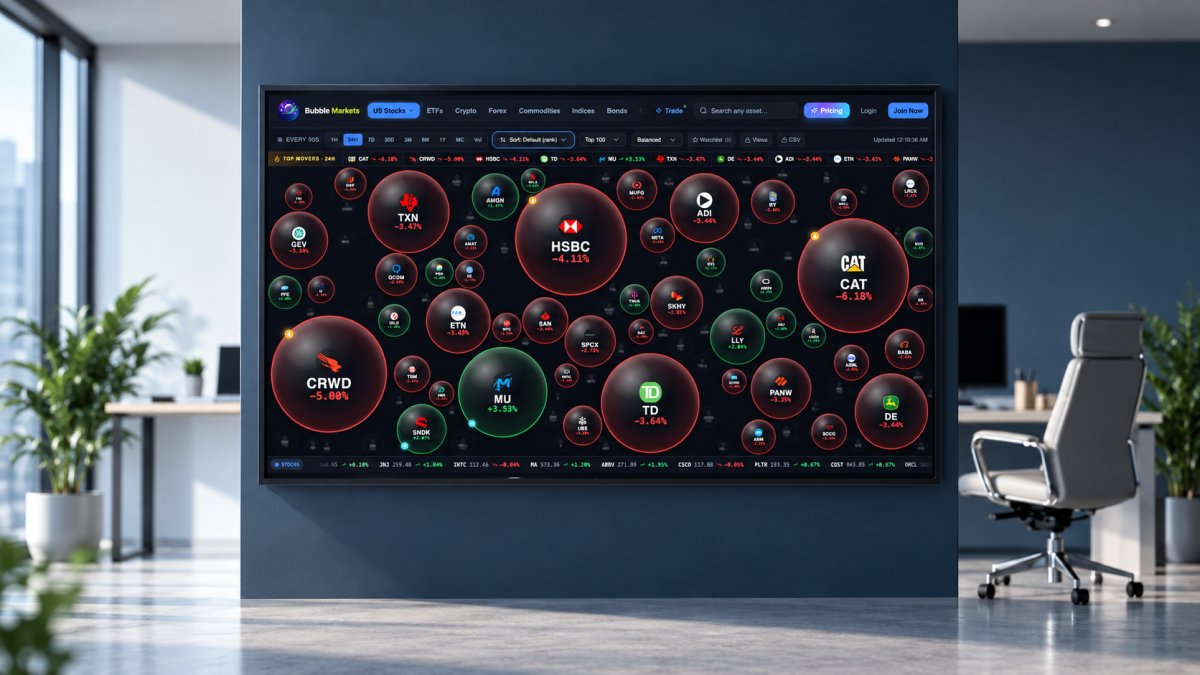
A large crypto bubble doesn’t automatically mean a coin is gaining. When analyzing a bubble map, bubble size represents the specific metric selected for the visualization; size alone doesn’t show whether an asset is rising or falling. Read it alongside the map’s other visual cues and timeframe.
It’s easy to focus on the biggest circles, but their meaning depends on how the map calculates size and how often its data updates. This guide explains how to interpret bubble size, use color and relative movement to spot market rotation and outliers, and compare timeframes without mistaking a brief move for a broader trend. It also covers how calculation methods and data delays can change what you see, and where a bubble map’s limits matter. The result is a clearer way to read BubbleMarkets and similar tools as market visualizations, not standalone indicators of risk or direction.
Key Takeaways
- Read bubble size by identifying the metric behind it, then compare that measure with color and other visual cues.
- Use more than one timeframe to distinguish a brief outlier from a broader shift in market performance.
- Interpret map patterns with care: coverage, calculation choices, and update timing can shape what appears on screen.
- Explore a live bubble map when you want to scan crypto or stock market movements visually.
What Does Bubble Size Mean?
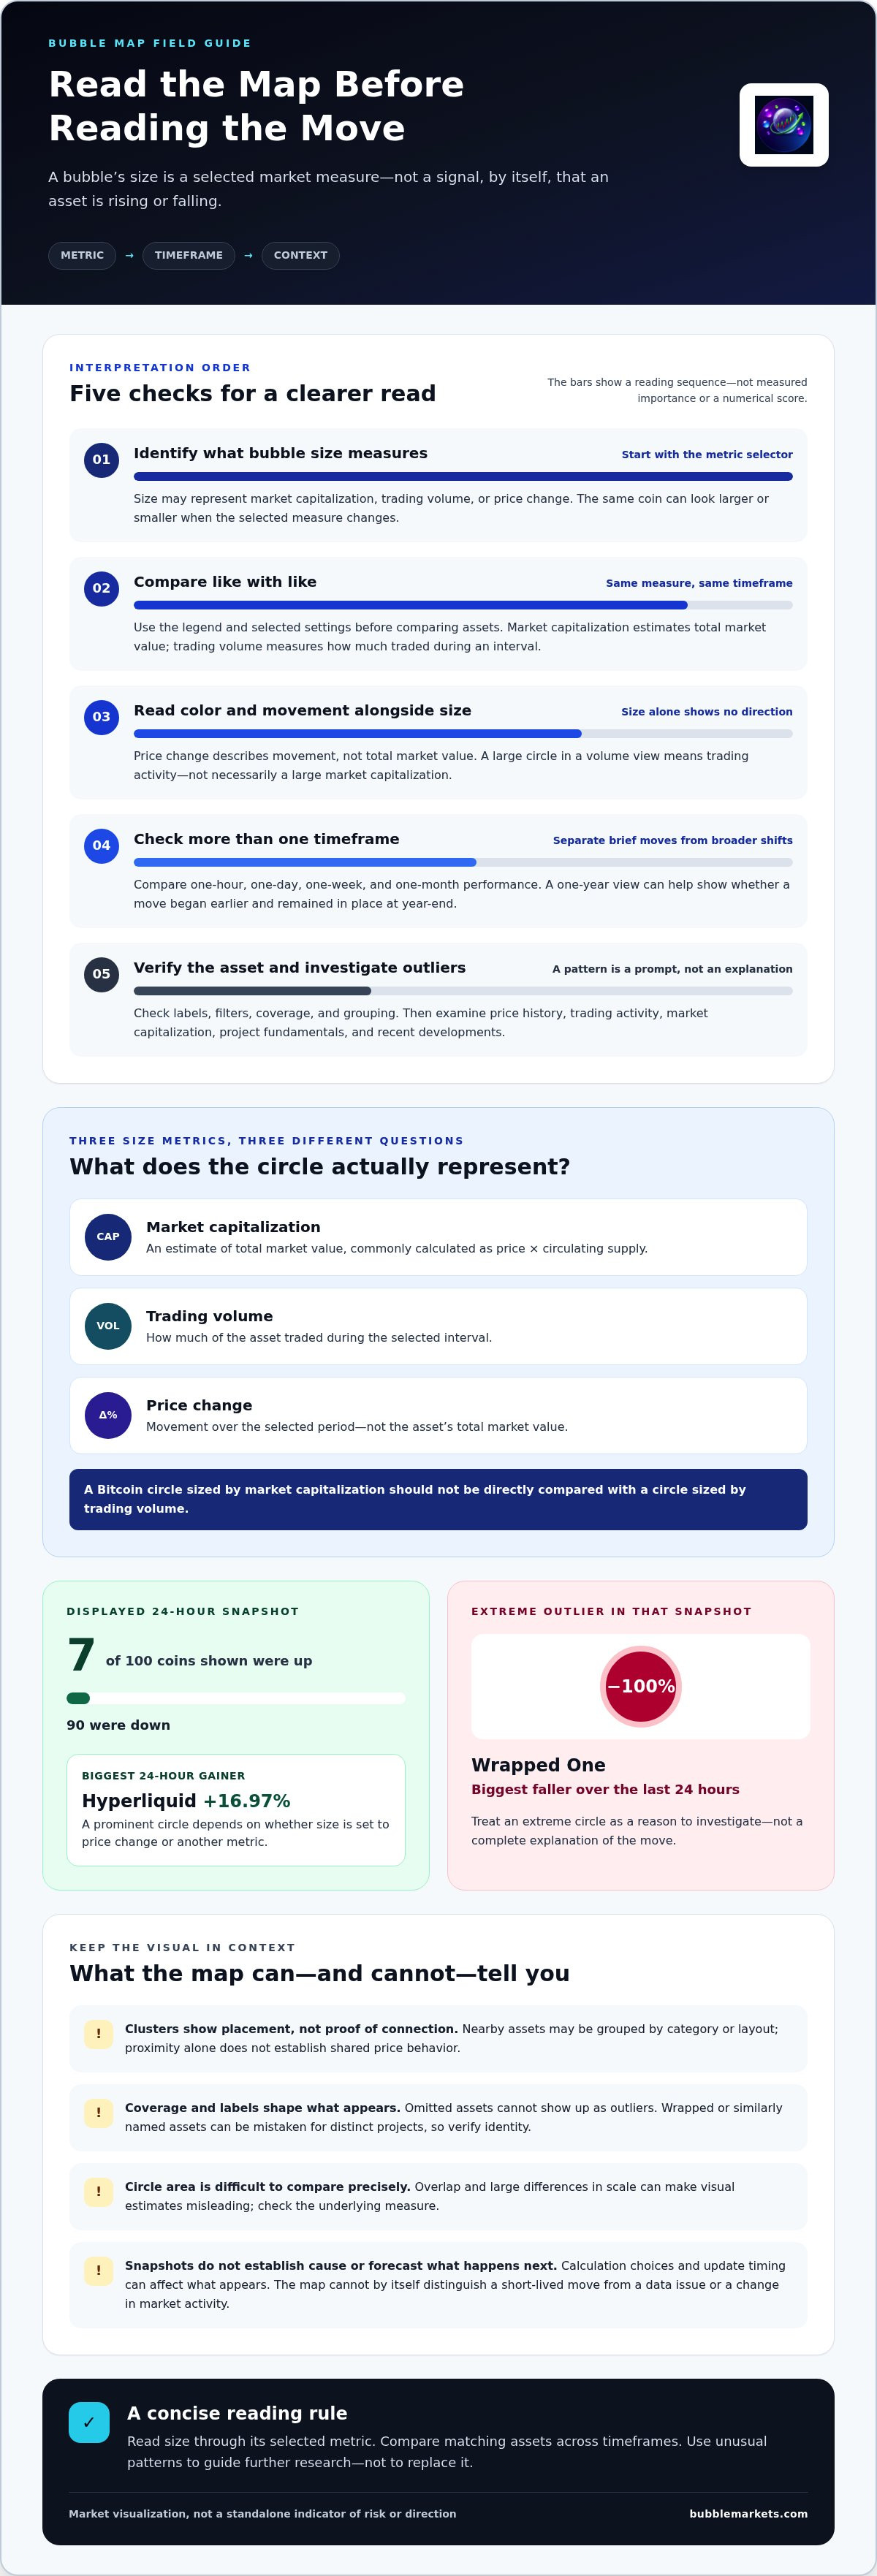
A crypto bubble map displays assets as circles, using size, color, and position to show selected market data. To read one, first identify the size metric: a large circle may represent market capitalization, trading volume, or price change. In a cryptobubbles vs bubble map comparison, that setting matters more than circle size alone.
Bubble Size Metrics
Bubble size visually represents one selected measure, such as market capitalization, trading volume, or price change. Its meaning depends on the map’s settings, so the same coin can appear large in one view and smaller in another. Check the legend or metric selector before comparing circles; otherwise, you might mistake size for performance or trading activity. This is a key distinction in a cryptobubbles vs bubble map comparison.
Market Capitalization and Trading Volume
Market capitalization estimates an asset’s total market value, commonly calculated by multiplying its price by its circulating supply. Trading volume measures how much of the asset traded during a selected interval. A map sized by market capitalization emphasizes relative market value, while one sized by volume emphasizes trading activity. These measures answer different questions, so a large circle in a volume view doesn’t necessarily indicate a large market capitalization.
Price change offers another possible size metric, but it describes movement rather than total market value. For example, Hyperliquid was the biggest 24-hour gainer in the displayed snapshot, rising 16.97% over the last 24 hours. If a map uses price change for size, that move could produce a prominent circle. If size instead represents market capitalization, the same gain affects color or another indicator, not necessarily circle size.
Compare like with like. Don’t judge a Bitcoin circle sized by market capitalization directly against an asset circle sized by trading volume. First select the same metric and timeframe for each asset, then use the map’s legend to interpret the visual scale. This helps distinguish a high-value asset from a highly traded one, or a sharp mover from both. Bubble size summarizes a chosen measure; it doesn’t explain why that measure changed.
Using the chart to spot market rotation and outliers
A crypto bubble map can group tokens by category and display selected market measures, such as performance, market capitalization, or trading activity. Clusters show assets positioned near one another by the map’s grouping or layout; proximity alone doesn’t prove a connection or shared price behavior. Check the labels and filters before interpreting a cluster as a market relationship.
To spot rotation, compare one-day, one-week, and one-month performance instead of relying on a single snapshot. A token’s one-hour rise may occur while it remains down over the week, so short-term strength can differ from the broader move. A one-year view can show whether a price move began earlier and remained in place at year-end.
In one displayed 24-hour snapshot, 7 of the 100 coins shown were up, while 90 were down. Wrapped One was the biggest faller, declining 100% over the last 24 hours. Treat an extreme circle as a prompt for investigation, not a complete explanation. Check the token’s price history, trading activity, market capitalization, project fundamentals, and recent developments.
Sector and market-cap filters narrow the view to a more comparable group. For example, compare tokens in the same category, then examine whether smaller or larger market-cap assets move together. A cluster that changes across a 24-hour and seven-day view may suggest shifting relative performance, but the map alone cannot establish why it changed. Use the selected category and timeframe to frame the comparison.
Market cycles also put outliers in context. CoinStats notes that crypto has experienced sharp declines after the 2013, 2017, and 2021 market peaks. Those examples show why a striking short-term gain should be read alongside longer-term movement. Compare the one-day, one-week, and one-month views, then investigate unusual assets individually; sentiment and color patterns describe observed performance, not future direction.
Bubble map limitations and risks
A bubble map compresses several market measures into a visual snapshot, but that simplification leaves out context. For example, a circle showing a token’s price change doesn’t explain its trading conditions, project fundamentals, or the reason for the move. Use the visualization to identify an area for closer analysis, not as a complete account of an asset.
Timeframe is another limitation. A token can look strong over a short interval while its longer-term performance remains weak. A map’s colors and circle positions represent the selected period, so compare different views before interpreting the pattern.
Coverage and grouping also affect what appears. A map displays only the assets and categories included in its dataset; omitted tokens can’t appear as outliers or affect the visible distribution. Wrapped versions or similarly named assets can also be mistaken for distinct projects. Read each label carefully and verify the asset’s identity before drawing conclusions from its placement.
Visual area can distort comparisons. Circle size is harder to judge precisely than a labeled value, especially when bubbles overlap or differ greatly in scale. A small circle appearing close to a large one doesn’t mean their market values or risks are similar. Check the underlying measure and compare like-for-like assets rather than estimating values by eye.
Finally, a bubble map can’t establish cause or forecast what happens next. A bright outlier could reflect a short-lived move, a data issue, or a change in market activity; the chart alone can’t distinguish among these explanations. Treat unusual patterns as prompts for further research. Examine price history, trading activity, market capitalization, project fundamentals, and recent developments before forming a view. A visual display organizes information; it doesn’t replace those checks or eliminate risk.
Data update frequency and calculation methodology
A bubble map reflects both its latest data and the rules used to calculate each display. A 24-hour performance figure, for example, depends on the chosen start and end points. If two maps use different refresh schedules or time boundaries, their readings may differ even when they show the same token.
Update frequency affects how closely a map reflects current market activity. A displayed value may lag a rapid price move if its underlying data refreshes later. Check any timestamp or update label alongside the chart, and treat older snapshots as historical context rather than current conditions. This matters most when comparing a brief one-hour move with a full-day view.
Calculation choices also shape the result. Price change may use a fixed opening value, while trading volume sums activity across a selected interval. Market capitalization depends on price and the supply figure used. If two maps use different intervals or supply inputs, a token’s displayed size or performance can vary even though the asset itself hasn’t changed.
Aggregation introduces another difference. A crypto price can vary across trading venues, and a map’s data source determines which observations feed its calculations. The selected token list also matters: a chart limited to certain assets may show a different distribution from one with broader coverage. Compare equivalent categories, metrics, and timeframes before interpreting visual differences as market shifts.
For a practical comparison, note the displayed metric, timeframe, timestamp, and asset coverage. Then compare one-day, one-week, and one-month views using the same settings. If a token appears to change sharply between snapshots, separate the actual market move from a change in refresh timing or calculation inputs. To examine current crypto and stock movement in a visual format, explore live market bubble maps.
BubbleMarkets: Free Live Market Bubble Maps
BubbleMarkets lets you scan crypto or stock market activity by comparing assets on a map instead of inspecting them one at a time. Its free live market maps include Crypto and Stock Market views, helping you apply the chart-reading principles above across different markets.
Start with the relevant map, then interpret its measures and timeframes in context. A bubble map helps organize market data visually; it doesn’t explain every move or replace further research. If you want more features, BubbleMarkets also offers Pro, Professional, and Enterprise subscriptions.
Visit BubbleMarkets to explore the maps.
Make Your Next Comparison More Deliberate
Give each chart a clear purpose before opening it. Decide whether you’re comparing relative performance, market activity, or a group of related assets. That choice keeps your readout focused and makes the next research step more useful. A cryptobubbles vs bubble map comparison is most practical when you judge each view by the question it answers, rather than expecting every map to show the same picture.
Build a repeatable viewing habit: use consistent filters, note the selected timeframe, and record which assets draw your attention. This creates a more useful reference for future market reviews than relying on a striking snapshot alone. Keep the map as one part of your research process, and use your observations to decide what deserves a closer look.
For a next step tailored to your needs, contact BubbleMarkets to discuss your needs. A clear question is a good place to begin.
Frequently Asked Questions
What Risks and Warning Signs Should Users Consider?
Watch for signs that a bubble-map signal needs closer review: a stale timestamp, an unfamiliar token label, or a sharp price move alongside little trading activity. For example, if an unfamiliar token suddenly dominates a view, confirm its identity and examine its trading activity and project updates. A striking visual change is a reason to investigate, not evidence on its own.
Which crypto bubble map tools and websites are popular?
BubbleMarkets offers free live bubble maps for crypto and other markets, including Crypto and Stock Market views. You can view charts without an account. When comparing maps, consider asset coverage, selectable measures, timeframe controls, and update information. These details help you decide whether a map suits the market question you want to explore.
What are the risks and limitations of using crypto bubble visualizations?
Bubble visualizations can omit assets, simplify complex market data, and make small differences difficult to judge by eye. They can’t explain why an asset moved or establish what happens next. Treat the display as a scanning aid, not an instruction to act. For example, use an unusual bubble to guide further research, then review project information and market data before making an independent decision.
Are Crypto Bubbles and bubble maps free, and what do paid plans include?
BubbleMarkets offers free live market bubble maps for scanning crypto or stock activity.
Frequently asked questions
What Risks and Warning Signs Should Users Consider?
Watch for signs that a bubble-map signal needs closer review: a stale timestamp, an unfamiliar token label, or a sharp price move alongside little trading activity. For example, if an unfamiliar token suddenly dominates a view, confirm its identity and examine its trading activity and project updates. A striking visual change is a reason to investigate, not evidence on its own.
Which crypto bubble map tools and websites are popular?
BubbleMarkets offers free live bubble maps for crypto and other markets, including Crypto and Stock Market views. You can view charts without an account. When comparing maps, consider asset coverage, selectable measures, timeframe controls, and update information. These details help you decide whether a map suits the market question you want to explore.
What are the risks and limitations of using crypto bubble visualizations?
Bubble visualizations can omit assets, simplify complex market data, and make small differences difficult to judge by eye. They can’t explain why an asset moved or establish what happens next. Treat the display as a scanning aid, not an instruction to act. For example, use an unusual bubble to guide further research, then review project information and market data before making an independent decision.
Are Crypto Bubbles and bubble maps free, and what do paid plans include?
BubbleMarkets offers free live market bubble maps for scanning crypto or stock activity.
Market information on this page is for education and general information only. It is not investment advice or a recommendation to buy or sell any asset.