 BubbleMarkets
European Stock Bubble Map: How to Scan Regional Equities in 2026

What can a single market snapshot tell you about European equities, and what can’t it? A european stock bubble map makes regional activity easier to scan, but exchanges, indices, currencies, and market hours don’t always line up neatly. Bubble size and colour can also look like signals, even when they only describe the data shown.
If you’re trying to see which markets, sectors, and stocks are moving, read the map across layers rather than focusing on one striking bubble. This guide explains how to interpret the visual encoding, compare European market activity, and use BubbleMarkets’ European stock bubble map to explore equities.
You’ll also learn what to check before drawing conclusions: coverage, data timestamp, currency basis, and the timing of the markets represented. A bubble map is a view of market data at a point in time, not a forecast or an investment recommendation. Read it with those limits in mind, and it can help organize your scan without overstating what the picture shows.
Key Takeaways
- Use a consistent sequence to scan European equities: compare market breadth, review sector patterns, then inspect individual constituents.
- A european stock bubble map helps organize market activity visually, but bubble size and colour describe selected data rather than predict future performance.
- Check whether movement is broad-based or concentrated in a few large companies before interpreting the overall picture.
- Compare regional results carefully when listings, currencies, and exchange trading hours differ.
- Use BubbleMarkets’ interactive visualizers to explore European equities, then consult company and market information for context the map can’t provide.
What a European stock bubble map shows at a glance
A European stock bubble map arranges selected equities as circles so you can compare a market metric across companies or categories in one view. A useful short definition is: A bubble map displays selected market data as a field of sized and coloured circles; a price chart plots how an asset’s value changes over time. The map emphasizes comparison at a glance, while a chart gives a more direct view of price history.
Before interpreting the visual, identify the metric and period. Circle size might show market capitalization, trading volume, or another measure, depending on the map settings. Colour might show price performance over a selected period, but it can encode something else in another view. A stock bubble map is a visualization, not evidence that a stock is in an economic bubble. It offers a snapshot of selected data, not a forecast or personalized investment recommendation.
What do bubble size, colour, and position mean?
Start with the legend and controls. If area represents market capitalization, a larger circle indicates a larger company by that measure, not necessarily stronger performance. If colour represents returns, check whether the period is intraday, daily, or longer. The same company can look different when the time window changes. Position may group securities by sector, exchange, or another category when the map supports that layout. Don’t assume any visual encoding without checking the selected view.
Which European stocks and markets can appear?
“European market” can refer to different things. An individual company is a listed business, such as a bank or manufacturer. An index tracks a defined group of securities: the DAX, FTSE 100, and CAC 40 are national benchmarks, while the STOXX Europe 600 represents a broader set of European companies. An exchange is the venue where securities trade, not an index or a company.
A european stock bubble map may focus on individual companies, display index-level data, or combine categories, depending on its coverage and filters. These familiar benchmarks help orient your analysis, but their names don’t establish that every constituent, European listing, or exchange appears in a particular map. Check the map’s selected region, securities, and available filters before drawing conclusions. This distinction matters when comparing what appears on screen with a broader index or national market.
How to scan European equities by market, sector, and stock
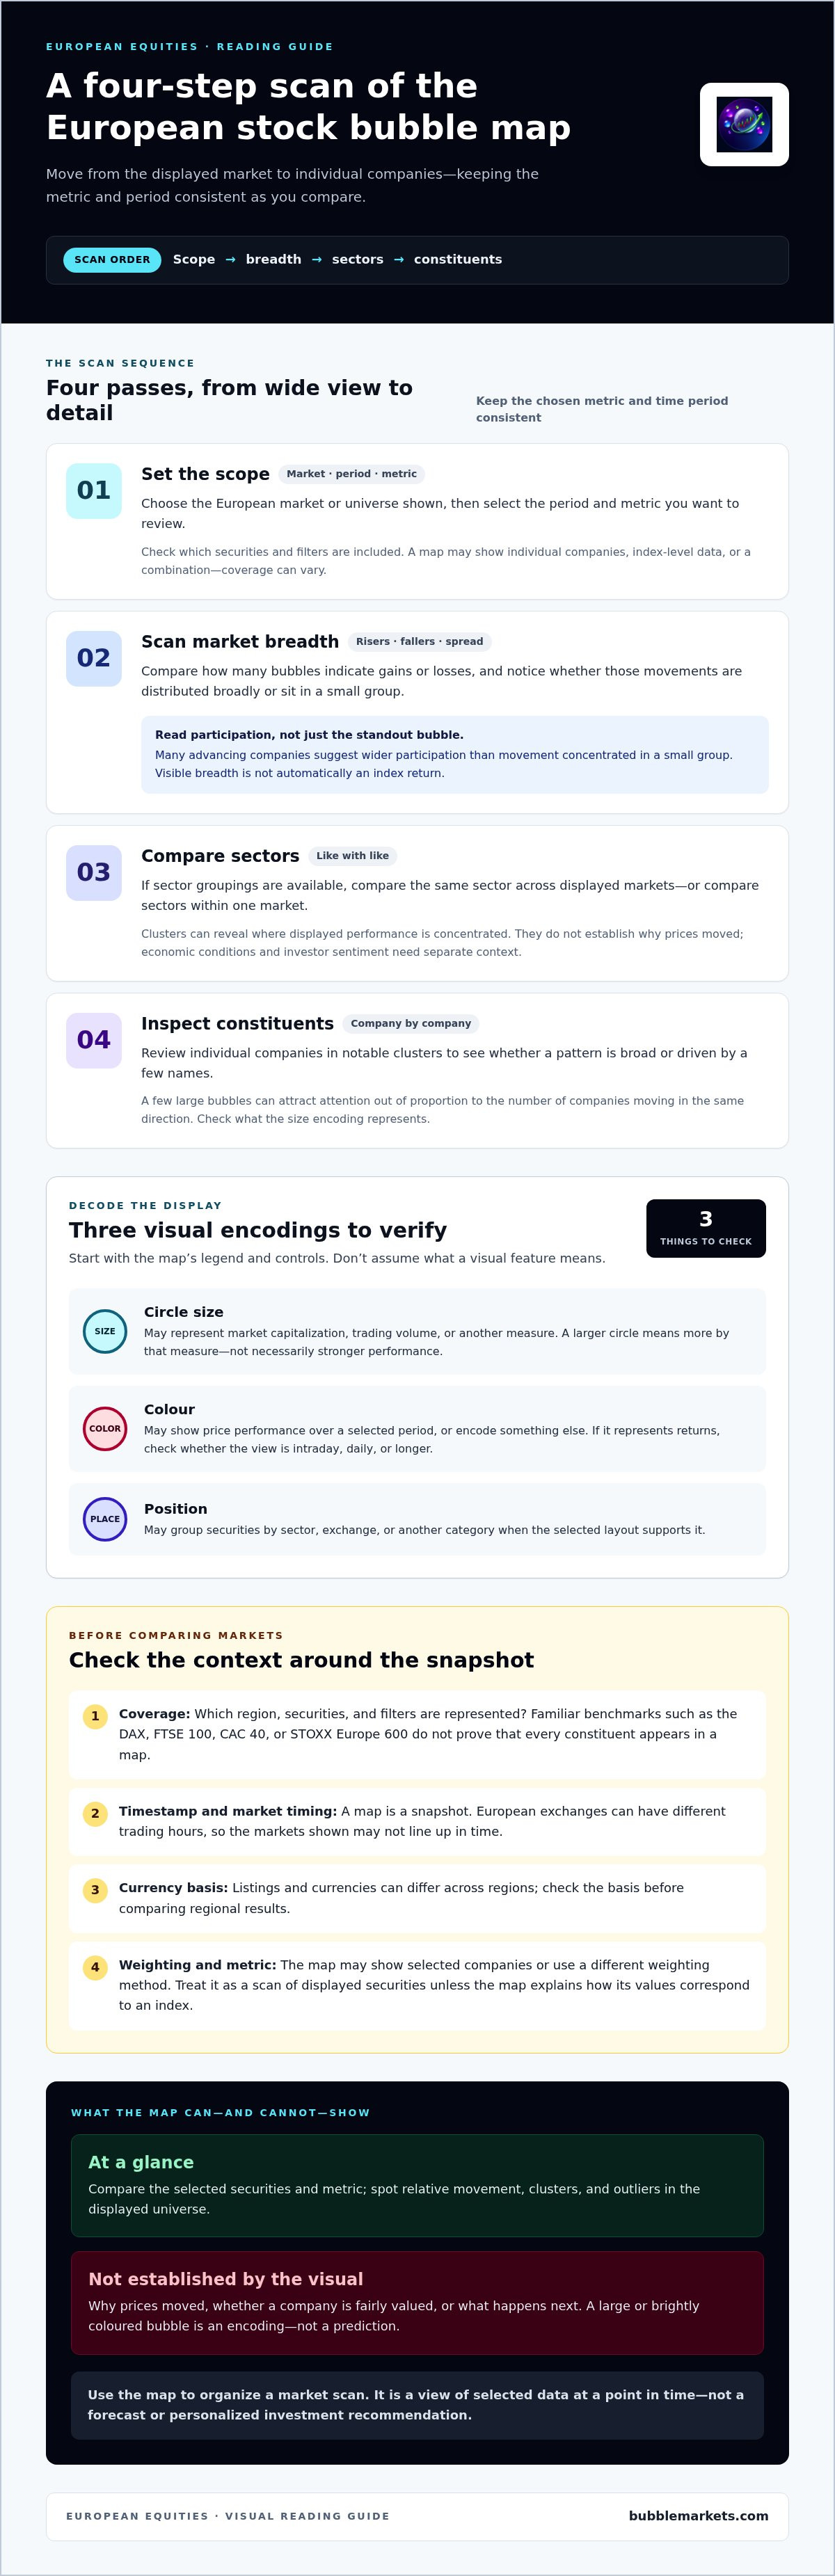
Use the same sequence each time you open a european stock bubble map: set the region and time frame, assess breadth, compare sectors, then inspect individual companies. Keeping the metric and period consistent makes comparisons more useful. For general bubble-map scanning principles, see this market bubble map guide.
- Set the scope. Choose the European market or universe shown, then select the period and metric you want to review.
- Scan breadth. Compare how many bubbles indicate gains or losses, and note whether those movements are spread across the display.
- Compare sectors. Look for clusters of similar performance, if sector groupings are available.
- Inspect constituents. Review individual companies within notable clusters to see whether a pattern is broad or driven by a few names.
How do you read European market breadth on the map?
Compare the number of rising and falling bubbles within the selected universe. Then consider their distribution: a screen with many advancing companies suggests wider participation than one where most movement sits in a small group. Check the size encoding, too. If a few large bubbles dominate the view, they may draw attention out of proportion to the number of companies moving in the same direction.
Visible breadth is not automatically an index return. A map may show selected companies rather than all index constituents, or represent performance using a different weighting method. Treat it as a scan of the displayed securities unless the map explicitly defines how its values correspond to an index.
How can sector groupings reveal regional differences?
When the map supports both regional and sector views, compare like with like: examine the same sector across displayed markets, or compare sectors within one market. A cluster can show where performance is concentrated and help direct further research, but it doesn’t establish why prices moved. Economic conditions and investor sentiment require additional context. The ESMA risk monitoring report offers a separate perspective on European financial-market vulnerabilities. For a broader regional comparison, see the world indices bubble map.
Hypothetical example: Suppose a map shows most companies in one sector rising, but only a few large companies in other sectors. That pattern suggests gains are concentrated, not necessarily shared across the wider market. Use the map to identify the cluster, then inspect its constituents and compare the selected period before drawing conclusions. To explore European equities visually, open the European stock bubble map.
What a European stock bubble map can, and cannot, tell you
A european stock bubble map helps compare the selected securities and metric at a glance. It can show relative movement, clusters, and outliers in its displayed universe. It can’t establish why prices moved, whether a company is fairly valued, or what happens next. A large or brightly coloured bubble is a visual encoding, not a prediction of future performance.
| Easy to see on the map | Requires separate research |
|---|---|
| Which displayed securities are rising or falling under the selected metric and period. | What caused a price move, including company news or wider economic conditions. |
| Relative bubble sizes and visible clusters, according to the map’s settings. | Whether a stock is attractively valued, or likely to rise or fall. |
| Differences across securities shown at the same time. | Whether the displayed set represents a whole index or market. |
Visual screening organizes what to investigate; investment analysis requires evidence beyond the map. The BIS discusses European equities in its review of valuation and investor sentiment, including conditions described as historically elevated levels. That broader context still doesn’t turn a bubble’s size or colour into a standalone assessment of a company.
Why can the same European market look different across time frames?
A daily view can highlight short-term moves, while a weekly or longer-period view may reveal a different pattern. A company that stands out over one session might look less exceptional over a month. Before comparing bubbles, check the selected period, metric, and data timestamp. European exchanges also open and close at different local times. A map captured while one market is trading and another is closed may combine prices from different points in the session. Use the timestamp shown by the map to understand the timing of the displayed data.
How do currencies and cross-listings affect comparisons?
European shares trade in different currencies. Displayed returns can therefore depend on the trading currency and any conversion convention used by the map. Check how values are expressed before comparing securities across countries. Likewise, a company’s listing venue doesn’t show the full geographic reach of its operations or revenue. Some companies may have more than one listing, so check how the map treats multiple listings and currency conversion before comparing results across countries.
Use the map to identify what merits a closer look, then verify the relevant company, market, and currency details before drawing conclusions.
A practical checklist for interpreting European stock bubbles
Before comparing a cluster or calling a market trend broad, capture the settings behind the display. This checklist helps keep a european stock bubble map scan consistent and separates what the visual shows from what still needs investigation.
- Region and universe: Confirm which European markets, securities, or index constituents are included. Note any market, index, or sector filters.
- Metric: Check whether size or colour represents price change, market capitalization, or another measure. Don’t infer the metric from appearance alone.
- Period: Record the comparison window, such as daily or weekly, so you’re not comparing bubbles measured over different intervals.
- Currency: Identify the display currency and consider whether securities trading in different currencies are directly comparable.
- Timestamp: Note when the data was captured. Different exchange hours can mean prices in one view come from different points in the trading day.
- Concentration: Check whether a few large constituents dominate the visual pattern. A cluster of large bubbles can shape the impression even if most displayed companies move differently.
Which settings should you check before comparing bubbles?
Use the same region, securities, metric, period, and currency basis for each comparison. If you change a filter or time window, treat the new view as a separate observation. This matters when comparing an index view with individual companies: the displayed constituents and the way the metric is calculated may differ. For broader screening-workflow considerations, read the visual stock screener buying guide.
How do you move from a visual pattern to useful research?
Describe the observation before proposing an explanation. For example, “Several companies in this sector show negative performance over the selected period” is a map-based observation. “The sector fell because of a specific event” is an explanation that needs supporting evidence.
Select a company or sector for closer review. Compare the visual pattern with company disclosures and relevant market context, and check whether the movement is shared across constituents or concentrated in a few. Keep the conclusion descriptive: the map helps organize research, but it doesn’t make a buy or sell recommendation.
Put the checklist into practice by exploring European equities with the interactive European stock map.
Explore European equities with BubbleMarkets’ interactive stock map
BubbleMarkets is a market data visualization platform with interactive maps for exploring stock-market movements, including European equities. A european stock bubble map can help you scan the securities represented in its current view, notice clusters, and select companies for closer review. Interpret the map according to the securities and data it displays, rather than assuming it includes every European listing.
How does an interactive map support a repeatable market scan?
A visual layout makes it easier to move from a broad view to individual securities: first notice how the displayed market is distributed, then focus on a sector or company that merits further research. For a consistent scan, note the map’s coverage, selected metric, comparison period, and timestamp before comparing patterns. BubbleMarkets’ screeners, customizable heat maps, portfolio tracking, price alerts, and AI-generated market summaries can add further ways to explore and monitor market data. Treat the visualizer as a research aid, not a substitute for independent analysis. The platform doesn’t execute trades or provide personalized investment advice.
When should you use a regional map alongside other views?
Use a European stock map to explore regional equities. If your question shifts to how major indices compare across regions, a world indices bubble map provides a broader frame. For screening criteria and ways to structure a wider search, consult the visual stock screener guide. Each view answers a different question, so keep its coverage and metric in mind.
BubbleMarkets’ visualizers support exploration of market data, not predictions or trading signals. Use the map to identify patterns worth checking, then bring in relevant company and market information before drawing conclusions. To explore the available market visualizers, visit BubbleMarkets.
Make your next European market scan clearer
A european stock bubble map is most useful when you read it in layers: first check the selected market and metric, then compare sector patterns, and finally inspect individual companies. Bubble size and colour help organize the snapshot, but they don’t explain what caused a move or predict what comes next.
Keep comparisons grounded by checking the time period, currency, timestamp, and securities shown. Then use company and market information to investigate patterns that catch your attention. This routine turns a visual scan into a clearer starting point for research, not a trading signal or personalized recommendation.
BubbleMarkets offers interactive visual market maps across global assets, with free live market visualizers and additional capabilities through Pro, Professional, and Enterprise subscriptions. Explore BubbleMarkets’ interactive market visualizers to scan European equities and other global markets.
Frequently Asked Questions
What is a European stock bubble map?
A European stock bubble map is a visual display of selected European equities, with circles arranged to help compare market data. Bubble size, colour, and position can each encode a different measure or category, depending on the map. It differs from a conventional price chart, which shows how an asset’s price changes over time. Check the map’s legend and coverage to understand what the displayed securities and visuals represent.
How do you read a European stock bubble map?
Start by checking the selected region, securities, metric, time period, and data timestamp. Then read the legend to see what circle size and colour mean. Compare the distribution of rising and falling bubbles, look for sector patterns if the map groups by sector, and inspect individual companies that stand out. This sequence helps separate a broad market pattern from movement concentrated in a few constituents.
What does bubble size represent on a stock map?
Bubble size represents the measure assigned by the map, not one universal value. It may show market capitalization, trading volume, or another selected metric. If size represents market capitalization, a larger bubble indicates a larger company by that measure, not a stronger return or better outlook. Check the map’s settings or legend before comparing circles, and avoid interpreting size as a signal about future performance.
What do the colours on a European stock map mean?
Colours often indicate performance, such as gains or losses over the selected period, but the meaning depends on the map’s chosen view. Check the legend to identify the metric, time window, and colour scale. A bright colour may show a larger measured move, not greater certainty or future growth. Colour is a visual cue for the displayed data, so use company and market information to investigate what may explain a pattern.
Can a stock bubble map show European sector performance?
Yes, if the map includes sector categories or a sector-based layout. Grouped bubbles can help you compare how displayed companies in areas such as banking, energy, or technology are performing over the same period. This view can reveal where movement appears concentrated, but it doesn’t explain the cause. Check which companies are included and compare the sector pattern with relevant company disclosures and market context.
Are European stock bubble maps real time?
Some platforms provide live market visualizers, but the precise data timing and update cadence depend on the map. Don’t assume every European exchange is trading or updating at the same moment. Check the timestamp and the market hours relevant to the displayed securities before comparing bubbles. A live view is still a snapshot of available data, and its timing can affect comparisons across exchanges.
Can a European stock bubble map predict which stocks will rise?
No. A European stock bubble map visualizes selected market data; it doesn’t predict future prices or establish that a stock will rise. Bubble size and colour describe the metric and period shown, not a guaranteed future outcome. Use the map to identify companies or sectors for further research, then assess relevant information independently. BubbleMarkets provides market visualizations, not personalized investment advice, trade execution, or trading signals.
Frequently asked questions
What do bubble size, colour, and position mean?
Start with the legend and controls. If area represents market capitalization, a larger circle indicates a larger company by that measure, not necessarily stronger performance. If colour represents returns, check whether the period is intraday, daily, or longer. The same company can look different when the time window changes. Position may group securities by sector, exchange, or another category when the map supports that layout. Don’t assume any visual encoding without checking the selected view.
Which European stocks and markets can appear?
“European market” can refer to different things. An individual company is a listed business, such as a bank or manufacturer. An index tracks a defined group of securities: the DAX, FTSE 100, and CAC 40 are national benchmarks, while the STOXX Europe 600 represents a broader set of European companies. An exchange is the venue where securities trade, not an index or a company. A european stock bubble map may focus on individual companies, display index-level data, or combine categories, depending on its coverage and filters. These familiar benchmarks help orient your analysis, but their names don’t establish that every constituent, European listing, or exchange appears in a particular map. Check the map’s selected region, securities, and available filters before drawing conclusions. This distinction matters when comparing what appears on screen with a broader index or national market. Use the same sequence each time you open a european stock bubble map: set the region and time frame, assess breadth, compare sectors, then inspect individual companies. Keeping the metric and period consistent makes comparisons more useful. For general bubble-map scanning principles, see this market bubble map guide.
How do you read European market breadth on the map?
Compare the number of rising and falling bubbles within the selected universe. Then consider their distribution: a screen with many advancing companies suggests wider participation than one where most movement sits in a small group. Check the size encoding, too. If a few large bubbles dominate the view, they may draw attention out of proportion to the number of companies moving in the same direction. Visible breadth is not automatically an index return. A map may show selected companies rather than all index constituents, or represent performance using a different weighting method. Treat it as a scan of the displayed securities unless the map explicitly defines how its values correspond to an index.
How can sector groupings reveal regional differences?
When the map supports both regional and sector views, compare like with like: examine the same sector across displayed markets, or compare sectors within one market. A cluster can show where performance is concentrated and help direct further research, but it doesn’t establish why prices moved. Economic conditions and investor sentiment require additional context. The ESMA risk monitoring report offers a separate perspective on European financial-market vulnerabilities. For a broader regional comparison, see the world indices bubble map. Hypothetical example: Suppose a map shows most companies in one sector rising, but only a few large companies in other sectors. That pattern suggests gains are concentrated, not necessarily shared across the wider market. Use the map to identify the cluster, then inspect its constituents and compare the selected period before drawing conclusions. To explore European equities visually, open the European stock bubble map. A european stock bubble map helps compare the selected securities and metric at a glance. It can show relative movement, clusters, and outliers in its displayed universe. It can’t establish why prices moved, whether a company is fairly valued, or what happens next. A large or brightly coloured bubble is a visual encoding, not a prediction of future performance. Visual screening organizes what to investigate; investment analysis requires evidence beyond the map. The BIS discusses European equities in its review of valuation and investor sentiment, including conditions described as historically elevated levels. That broader context still doesn’t turn a bubble’s size or colour into a standalone assessment of a company.
Why can the same European market look different across time frames?
A daily view can highlight short-term moves, while a weekly or longer-period view may reveal a different pattern. A company that stands out over one session might look less exceptional over a month. Before comparing bubbles, check the selected period, metric, and data timestamp. European exchanges also open and close at different local times. A map captured while one market is trading and another is closed may combine prices from different points in the session. Use the timestamp shown by the map to understand the timing of the displayed data.
How do currencies and cross-listings affect comparisons?
European shares trade in different currencies. Displayed returns can therefore depend on the trading currency and any conversion convention used by the map. Check how values are expressed before comparing securities across countries. Likewise, a company’s listing venue doesn’t show the full geographic reach of its operations or revenue. Some companies may have more than one listing, so check how the map treats multiple listings and currency conversion before comparing results across countries. Use the map to identify what merits a closer look, then verify the relevant company, market, and currency details before drawing conclusions. Before comparing a cluster or calling a market trend broad, capture the settings behind the display. This checklist helps keep a european stock bubble map scan consistent and separates what the visual shows from what still needs investigation.
Which settings should you check before comparing bubbles?
Use the same region, securities, metric, period, and currency basis for each comparison. If you change a filter or time window, treat the new view as a separate observation. This matters when comparing an index view with individual companies: the displayed constituents and the way the metric is calculated may differ. For broader screening-workflow considerations, read the visual stock screener buying guide.
How do you move from a visual pattern to useful research?
Describe the observation before proposing an explanation. For example, “Several companies in this sector show negative performance over the selected period” is a map-based observation. “The sector fell because of a specific event” is an explanation that needs supporting evidence. Select a company or sector for closer review. Compare the visual pattern with company disclosures and relevant market context, and check whether the movement is shared across constituents or concentrated in a few. Keep the conclusion descriptive: the map helps organize research, but it doesn’t make a buy or sell recommendation. Put the checklist into practice by exploring European equities with the interactive European stock map. BubbleMarkets is a market data visualization platform with interactive maps for exploring stock-market movements, including European equities. A european stock bubble map can help you scan the securities represented in its current view, notice clusters, and select companies for closer review. Interpret the map according to the securities and data it displays, rather than assuming it includes every European listing.
How does an interactive map support a repeatable market scan?
A visual layout makes it easier to move from a broad view to individual securities: first notice how the displayed market is distributed, then focus on a sector or company that merits further research. For a consistent scan, note the map’s coverage, selected metric, comparison period, and timestamp before comparing patterns. BubbleMarkets’ screeners, customizable heat maps, portfolio tracking, price alerts, and AI-generated market summaries can add further ways to explore and monitor market data. Treat the visualizer as a research aid, not a substitute for independent analysis. The platform doesn’t execute trades or provide personalized investment advice.
When should you use a regional map alongside other views?
Use a European stock map to explore regional equities. If your question shifts to how major indices compare across regions, a world indices bubble map provides a broader frame. For screening criteria and ways to structure a wider search, consult the visual stock screener guide. Each view answers a different question, so keep its coverage and metric in mind. BubbleMarkets’ visualizers support exploration of market data, not predictions or trading signals. Use the map to identify patterns worth checking, then bring in relevant company and market information before drawing conclusions. To explore the available market visualizers, visit BubbleMarkets. A european stock bubble map is most useful when you read it in layers: first check the selected market and metric, then compare sector patterns, and finally inspect individual companies. Bubble size and colour help organize the snapshot, but they don’t explain what caused a move or predict what comes next. Keep comparisons grounded by checking the time period, currency, timestamp, and securities shown. Then use company and market information to investigate patterns that catch your attention. This routine turns a visual scan into a clearer starting point for research, not a trading signal or personalized recommendation. BubbleMarkets offers interactive visual market maps across global assets, with free live market visualizers and additional capabilities through Pro, Professional, and Enterprise subscriptions. Explore BubbleMarkets’ interactive market visualizers to scan European equities and other global markets.
What is a European stock bubble map?
A European stock bubble map is a visual display of selected European equities, with circles arranged to help compare market data. Bubble size, colour, and position can each encode a different measure or category, depending on the map. It differs from a conventional price chart, which shows how an asset’s price changes over time. Check the map’s legend and coverage to understand what the displayed securities and visuals represent.
How do you read a European stock bubble map?
Start by checking the selected region, securities, metric, time period, and data timestamp. Then read the legend to see what circle size and colour mean. Compare the distribution of rising and falling bubbles, look for sector patterns if the map groups by sector, and inspect individual companies that stand out. This sequence helps separate a broad market pattern from movement concentrated in a few constituents.
What does bubble size represent on a stock map?
Bubble size represents the measure assigned by the map, not one universal value. It may show market capitalization, trading volume, or another selected metric. If size represents market capitalization, a larger bubble indicates a larger company by that measure, not a stronger return or better outlook. Check the map’s settings or legend before comparing circles, and avoid interpreting size as a signal about future performance.
What do the colours on a European stock map mean?
Colours often indicate performance, such as gains or losses over the selected period, but the meaning depends on the map’s chosen view. Check the legend to identify the metric, time window, and colour scale. A bright colour may show a larger measured move, not greater certainty or future growth. Colour is a visual cue for the displayed data, so use company and market information to investigate what may explain a pattern.
Can a stock bubble map show European sector performance?
Yes, if the map includes sector categories or a sector-based layout. Grouped bubbles can help you compare how displayed companies in areas such as banking, energy, or technology are performing over the same period. This view can reveal where movement appears concentrated, but it doesn’t explain the cause. Check which companies are included and compare the sector pattern with relevant company disclosures and market context.
Are European stock bubble maps real time?
Some platforms provide live market visualizers, but the precise data timing and update cadence depend on the map. Don’t assume every European exchange is trading or updating at the same moment. Check the timestamp and the market hours relevant to the displayed securities before comparing bubbles. A live view is still a snapshot of available data, and its timing can affect comparisons across exchanges.
Can a European stock bubble map predict which stocks will rise?
No. A European stock bubble map visualizes selected market data; it doesn’t predict future prices or establish that a stock will rise. Bubble size and colour describe the metric and period shown, not a guaranteed future outcome. Use the map to identify companies or sectors for further research, then assess relevant information independently. BubbleMarkets provides market visualizations, not personalized investment advice, trade execution, or trading signals.
Market information on this page is for education and general information only. It is not investment advice or a recommendation to buy or sell any asset.