 BubbleMarkets
Forex Market Bubble Chart: How to Read Currency-Pair Moves

What if the largest bubble on your screen tells you less than its position? A forex market bubble chart can show several currency-pair moves at once, but position, size, and color only make sense when you know what the axes and legend represent. Without that context, it’s easy to compare pairs incorrectly or mistake a snapshot for a forecast.
That confusion is understandable: EUR/USD and USD/JPY list the US dollar in different positions. A pair’s move reflects the base currency against the quote currency, while bubble size and color can represent different metrics depending on the chart. This article explains how to read those signals, compare pairs consistently, and follow a repeatable scan for relative moves. It also covers what a bubble chart can’t establish: it arranges selected data at a point in time, but doesn’t explain why a move is happening or whether it will continue.
Key Takeaways
- Check the legend and chart settings first. Bubble size and color can mean different things in different visualizers.
- Read each pair in order: the first currency is the base, and the second is the quote. A rising quote means the base is strengthening relative to the quote.
- Use a forex market bubble chart to scan pair performance, then compare bubbles only when the metric and timeframe match.
- Follow a consistent scan: set the scope, confirm coverage and settings, spot clusters, inspect individual pairs, and check broader context.
- Treat visual patterns as a starting point for analysis, not evidence of cause, liquidity, future direction, or trade suitability.
What a Forex Market Bubble Chart Shows at a Glance
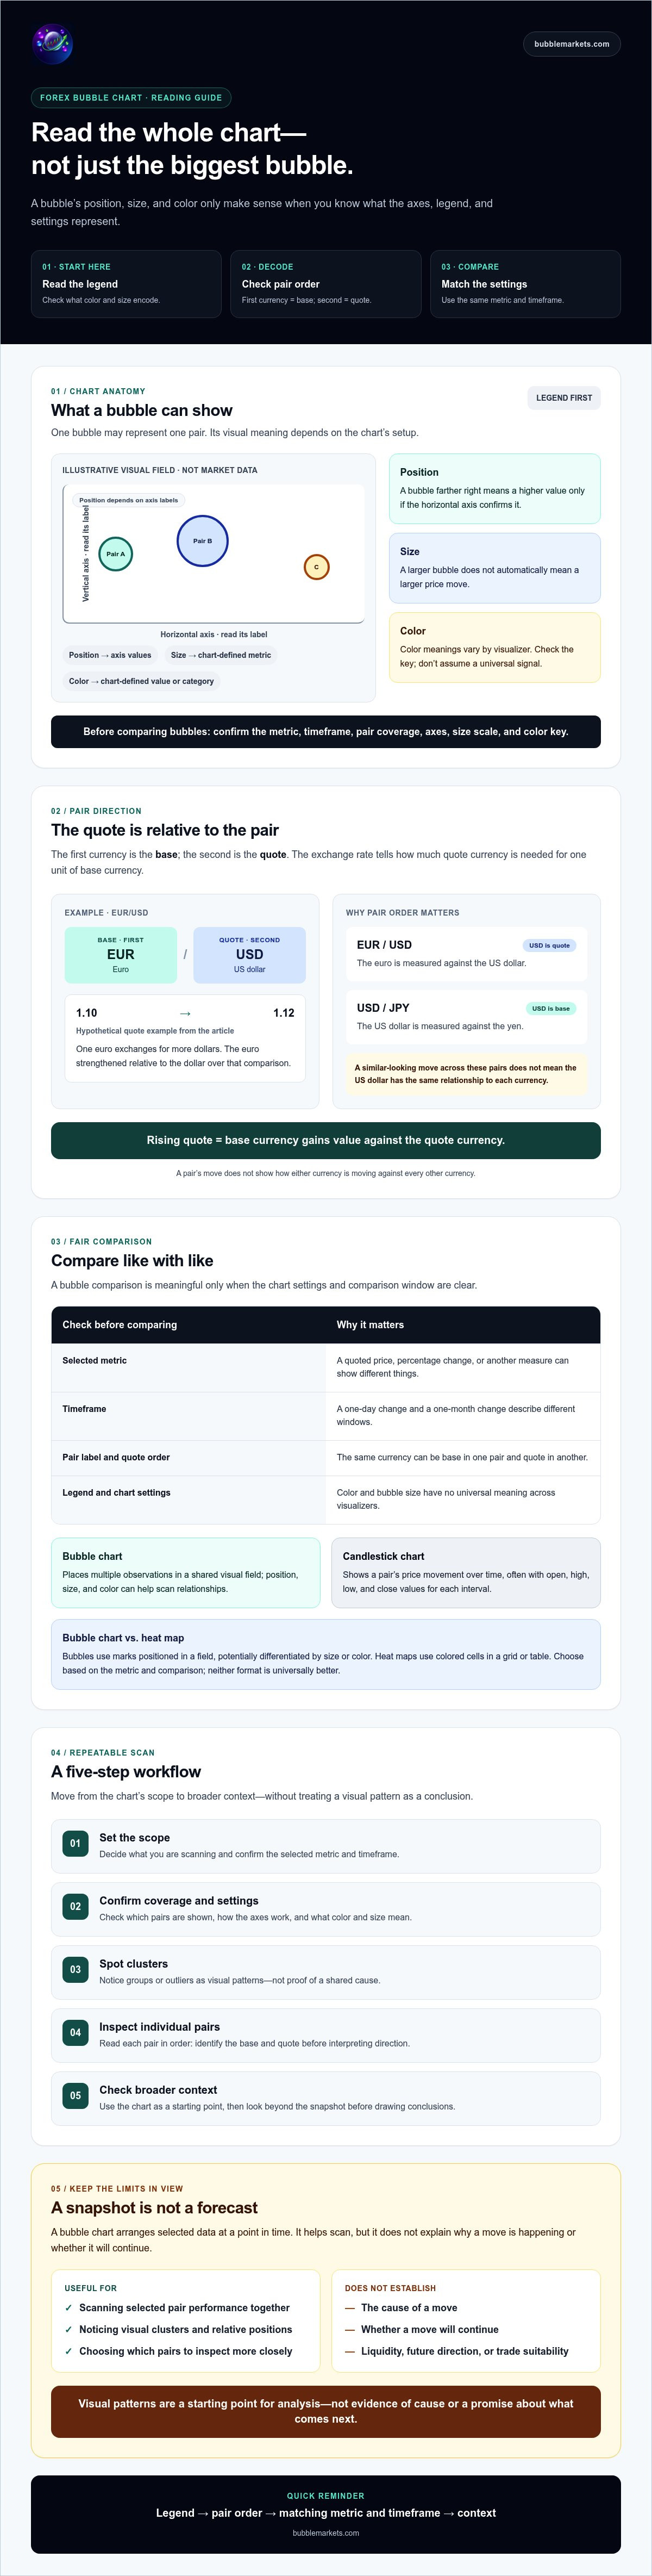
A bubble chart places market data in a visual field so you can scan several observations together. In forex, each bubble may represent a currency pair, with position, color, or size encoding selected data. The exact meaning depends on the chart’s setup, so start with its legend before drawing conclusions.
Check the axes and labels first. They may show different metrics, and the timeframe determines the period being compared. Then inspect the color key and bubble-size scale. Don’t assume a larger bubble means a bigger price move, or that a particular color always signals strength. Those meanings vary by visualizer. BubbleMarkets offers a Forex Bubble Map and Forex Pairs Bubble Map. Check the displayed metrics, pair coverage, and visual encoding in the chart itself.
This view differs from a candlestick chart, which shows a pair’s price movement over time, often with open, high, low, and close values for each interval. A bubble chart puts multiple data points into a shared visual field instead. It’s useful for scanning relationships, but it doesn’t provide the same chronological price detail as candles. For a wider explanation of visual market scanning across asset classes, see the market bubble map guide.
What does each bubble represent?
One bubble may stand for one forex pair if the chart’s documented setup defines it that way. For example, a hypothetical EUR/USD bubble positioned to the right could indicate a higher value on the horizontal axis, but only if the axis label confirms that interpretation. Check the legend for the bubble’s color and size, too. A bubble chart displays market data; it doesn’t by itself establish that a currency is in an economic bubble.
How is a forex bubble chart different from a heat map?
A bubble chart uses marks positioned in a field, potentially differentiated by size or color. A heat map uses colored cells arranged in a grid or table. Both can help scan many instruments quickly: bubbles emphasize position and relative size, while cells make color-coded categories easy to compare. Neither format is universally better. Choose based on the metric and comparison you need, then check the legend and timeframe before interpreting the display.
How Forex Pair Quotes Shape What a Bubble Chart Means
You can’t interpret a bubble’s position correctly until you know what its currency pair means. In a pair, the base currency is listed first and the quote currency second. The quoted exchange rate tells you how much of the quote currency is needed for one unit of the base currency. Corporate Finance Institute’s currency pair guide explains this convention in more detail.
How to read base and quote currencies
In EUR/USD, the euro is the base currency and the US dollar is the quote currency. If the quote hypothetically rises from 1.10 to 1.12, one euro exchanges for more dollars than before. That means the euro has strengthened relative to the dollar over that comparison, or the dollar has weakened relative to the euro. It doesn’t tell you how either currency is moving against every other currency.
Pair direction is relative: a rising quote means the base currency is gaining value against the quote currency.
This distinction matters when comparing bubbles. EUR/USD and USD/JPY put the US dollar in different positions: it’s the quote currency in the first pair and the base currency in the second. A similar-looking move across both bubbles therefore doesn’t mean the dollar has the same relationship to each currency. Check the pair label and quote convention before grouping movements as broad currency strength or weakness.
What color, position, and size can indicate
In a forex market bubble chart, a bubble’s visual features have no universal meaning. Color might distinguish positive and negative values, or represent another category. Position depends on the chart’s axes, and size may encode a separate metric. Don’t infer that a bubble farther right represents a rising exchange rate unless the horizontal axis says so.
Read the legend and settings together. Confirm the selected metric and observation timeframe before comparing pairs: a one-day change and a one-month change describe different windows, even if their bubbles appear side by side. Check whether the chart displays a pair’s quoted price, percentage change, or another measure. The same pair can appear differently when the metric or period changes.
For a practical scan, first identify each pair’s base and quote currencies, then read the metric and timeframe attached to its bubble. This keeps the visual comparison separate from the currency relationship it represents. You can apply that process with a Forex Pairs Bubble Map, checking its displayed labels and legend rather than assuming a particular encoding.
How to Compare Forex Pairs Without Misreading the Chart
A useful comparison starts with consistency. In a forex market bubble chart, compare bubbles only when they show the same metric over the same observation timeframe. A percentage change over one day isn’t directly comparable with a percentage change over one month. If the chart’s settings differ, an apparent contrast may come from the measurement window rather than the pairs themselves.
How timeframe changes the comparison
A short-window view captures movement over a narrower interval; a broader window shows how that move fits into a longer period. Neither is automatically the right choice. The same pair can appear to move differently across two snapshots because the selected intervals differ. Before comparing bubbles, note the metric and timeframe shown in the chart. That makes it easier to interpret the comparison later.
The table below is hypothetical. It illustrates how to record a consistent comparison, not live market data.
| Pair | Observed move | Timeframe | Interpretation caveat |
|---|---|---|---|
| EUR/USD | +0.4% | Same one-day interval | Shows the euro’s relative move against the US dollar, not against all currencies. |
| GBP/USD | +0.2% | Same one-day interval | Shares the US dollar as quote currency; the figure alone doesn’t explain why it moved. |
| USD/JPY | -0.1% | Same one-day interval | The US dollar is the base currency here, so read the direction according to that pair’s quote. |
How currency overlap affects a scan
Several pairs can share one currency, creating overlapping exposure in a scan. In the hypothetical table, EUR/USD and GBP/USD both include USD as the quote currency, while USD/JPY uses it as the base. Their movements aren’t three fully independent observations of market conditions. Note which currency appears in each pair, and avoid treating similar moves as separate confirmation.
Related movements alone don’t establish a cause or show that one currency drove the others. The chart displays selected data; it doesn’t explain the relationship behind it. For another example of scanning a visual market display, see the stock market heat map guide.
A Practical Workflow for Scanning a Forex Bubble Chart
A repeatable process helps separate what the display shows from what you infer. Before scanning a forex bubble chart, confirm the metric, timeframe, pair coverage, and visual legend. Check whether values are absolute, relative, or transformed, and note the chart’s data timing if it’s provided. Missing pairs or limited coverage can affect the picture, so don’t assume the map represents the entire forex market.
- Select scope. Choose the currencies or pairs relevant to your scan. Check which pairs are included and note any coverage limits.
- Check settings. Read the axes, color key, size scale, selected metric, and timeframe. Confirm how values are calculated before comparing bubbles.
- Scan clusters. Look for groups or outliers as observations to investigate, not evidence of a forecast. Note which currencies appear across related pairs.
- Inspect pairs. Select an individual pair and review its values and labels. If a pattern looks unusual, check a conventional price chart to see how the pair moved over time.
- Verify context. Compare the observation with relevant market information. Record what the chart displays separately from your interpretation or any decision.
What to check before drawing a conclusion
Make a quick note of the metric, timeframe, pair coverage, and data timing. A value might be a direct quote, a percentage change, or another transformed measure; those aren’t interchangeable. If the visualizer doesn’t disclose a setting or update detail, treat it as unknown rather than filling in the gap. These checks make comparisons more consistent, but they don’t validate a prediction.
How to investigate an unusual visual pattern
Use the bubble view to identify what deserves a closer look. Open a conventional price chart for the pair, then compare the movement with relevant market context without assuming that one explains the other. Keep three notes distinct: the visible observation, your possible interpretation, and any decision made separately. For a comparison of visual scanning methods in another market context, see the sector rotation heat map guide.
To apply this process in a dedicated visualization, explore the Forex Bubble Map. Use it to scan and inspect displayed data, not as a forecast or personalized recommendation.
What a Forex Market Bubble Chart Cannot Tell You
A forex market bubble chart organizes selected data for visual comparison. It doesn’t forecast future exchange rates. A cluster, outlier, or large bubble can direct your attention, but the display alone can’t explain what caused a move or establish whether it will continue.
A visual pattern also doesn’t establish liquidity or whether a particular trade is suitable. Those questions require information and analysis beyond the chart. Treat the map as an educational scanning tool: it presents data according to its settings, not personalized financial advice, brokerage execution, or trading signals.
Common forex bubble-chart misreadings
Keep these limits in view as you scan:
- Assuming size means importance. Check the legend to see what bubble size represents before interpreting it.
- Comparing mismatched settings. Pairs shown over different periods or using different metrics can’t be compared directly.
- Reading a cluster as proof. Several related pairs may move together, but the visual grouping doesn’t establish a shared cause.
These checks help keep observation separate from inference. If the chart doesn’t clearly document an encoding or setting, don’t assign it a meaning.
When to use BubbleMarkets’ forex visualizer
BubbleMarkets offers a Forex Bubble Map and free live market visualizers for scanning market data. Use the forex map to organize pair-level observations, then check the displayed legend, metric, timeframe, coverage, and data timing where available. Features and coverage can vary, so verify what the current visualization shows rather than assuming specific pairs or encodings.
A careful scan can help you identify what to examine next; it can’t replace further analysis or determine an outcome. BubbleMarkets provides visualizations, not financial advice or trade execution. Explore BubbleMarkets’ forex visualizer as one option for applying the scanning approach.
Make Your Next Market Scan More Consistent
A forex market bubble chart can help you compare currency-pair moves in one view, provided you understand its legend, metric, and timeframe. Read each pair’s base and quote currencies before interpreting its direction, and compare bubbles only when their measurement settings match.
Use the chart to spot observations worth investigating, not to infer a cause or forecast an exchange rate. A cluster or large bubble doesn’t establish liquidity, future movement, or trade suitability. Check notable patterns against other market information, and keep what the chart shows separate from your interpretation.
BubbleMarkets lists both a Forex Bubble Map and a Forex Pairs Bubble Map among its offerings, alongside free live market visualizers across asset classes. Confirm the current labels, coverage, and settings as you use the visualization. Explore BubbleMarkets’ forex visualizer to put this scanning workflow into practice.
Frequently Asked Questions
What is a forex market bubble chart?
A forex market bubble chart is a visual way to scan data for multiple currency pairs in one view. Each bubble’s position, color, and size depend on the chart’s legend and settings, so their meaning can vary between tools. The chart summarizes selected data; it doesn’t predict exchange rates. Before interpreting a pattern, check which metric is displayed and the timeframe it covers.
How do you read a forex bubble chart?
Start with the legend, selected pairs, metric, and timeframe. Then read each pair in order: the first currency is the base, and the second is the quote. For EUR/USD, a rising quote means the euro is strengthening relative to the US dollar. Compare bubbles only when their settings match. If a move stands out, check a conventional price chart for context; don’t treat a visual pattern as a signal or forecast.
What does bubble size mean on a forex chart?
Bubble size represents the metric selected for that visualization, and its meaning can differ between tools. Don’t assume a larger bubble indicates greater volume, volatility, or performance. Check the chart legend or controls to see what size encodes. If the interface doesn’t disclose the size metric, treat bubble size as uninterpretable until you can confirm the setting. Position and color also require their own legend checks.
Can a forex bubble chart predict currency movements?
No. A chart snapshot can’t establish the future direction of an exchange rate. It organizes selected currency-pair data and can help identify patterns to investigate, but it doesn’t prove why a move happened or what comes next. Use relevant market context and other forms of analysis to assess what you’re seeing. The visualization isn’t personalized financial advice, a trading signal, or a guarantee of an outcome.
How is a forex bubble chart different from a forex heat map?
A bubble chart represents observations as circles positioned and styled according to the selected settings. A heat map typically uses colored cells in a grid to display values. Bubbles can emphasize spatial position and relative size, while cells provide a grid-based color comparison. The details vary by platform, and neither format is always better. Choose based on the comparison you need, then check the legend, metric, and timeframe.
Which currency pairs should I include in a forex bubble chart?
There’s no universally correct pair list. Start with the pairs relevant to your market scan, then check which ones the chart actually covers and note currencies that appear in multiple pairs. A visualizer may not display every available pair, so don’t assume the map represents the entire market. This comparison is a way to organize observations, not a personalized investment recommendation or trading signal.
Is a forex market bubble chart updated in real time?
Update timing depends on the specific chart, its data source, and the service being used. Check the visualizer’s published data-timing information instead of assuming that “live” means instantaneous or that every pair updates identically. BubbleMarkets offers free live market visualizers, but verify the current forex coverage and update details in the visualizer before relying on a specific refresh interval.
Frequently asked questions
What does each bubble represent?
One bubble may stand for one forex pair if the chart’s documented setup defines it that way. For example, a hypothetical EUR/USD bubble positioned to the right could indicate a higher value on the horizontal axis, but only if the axis label confirms that interpretation. Check the legend for the bubble’s color and size, too. A bubble chart displays market data; it doesn’t by itself establish that a currency is in an economic bubble.
How is a forex bubble chart different from a heat map?
A bubble chart uses marks positioned in a field, potentially differentiated by size or color. A heat map uses colored cells arranged in a grid or table. Both can help scan many instruments quickly: bubbles emphasize position and relative size, while cells make color-coded categories easy to compare. Neither format is universally better. Choose based on the metric and comparison you need, then check the legend and timeframe before interpreting the display. You can’t interpret a bubble’s position correctly until you know what its currency pair means. In a pair, the base currency is listed first and the quote currency second. The quoted exchange rate tells you how much of the quote currency is needed for one unit of the base currency. Corporate Finance Institute’s currency pair guide explains this convention in more detail.
What is a forex market bubble chart?
A forex market bubble chart is a visual way to scan data for multiple currency pairs in one view. Each bubble’s position, color, and size depend on the chart’s legend and settings, so their meaning can vary between tools. The chart summarizes selected data; it doesn’t predict exchange rates. Before interpreting a pattern, check which metric is displayed and the timeframe it covers.
How do you read a forex bubble chart?
Start with the legend, selected pairs, metric, and timeframe. Then read each pair in order: the first currency is the base, and the second is the quote. For EUR/USD, a rising quote means the euro is strengthening relative to the US dollar. Compare bubbles only when their settings match. If a move stands out, check a conventional price chart for context; don’t treat a visual pattern as a signal or forecast.
What does bubble size mean on a forex chart?
Bubble size represents the metric selected for that visualization, and its meaning can differ between tools. Don’t assume a larger bubble indicates greater volume, volatility, or performance. Check the chart legend or controls to see what size encodes. If the interface doesn’t disclose the size metric, treat bubble size as uninterpretable until you can confirm the setting. Position and color also require their own legend checks.
Can a forex bubble chart predict currency movements?
No. A chart snapshot can’t establish the future direction of an exchange rate. It organizes selected currency-pair data and can help identify patterns to investigate, but it doesn’t prove why a move happened or what comes next. Use relevant market context and other forms of analysis to assess what you’re seeing. The visualization isn’t personalized financial advice, a trading signal, or a guarantee of an outcome.
How is a forex bubble chart different from a forex heat map?
A bubble chart represents observations as circles positioned and styled according to the selected settings. A heat map typically uses colored cells in a grid to display values. Bubbles can emphasize spatial position and relative size, while cells provide a grid-based color comparison. The details vary by platform, and neither format is always better. Choose based on the comparison you need, then check the legend, metric, and timeframe.
Which currency pairs should I include in a forex bubble chart?
There’s no universally correct pair list. Start with the pairs relevant to your market scan, then check which ones the chart actually covers and note currencies that appear in multiple pairs. A visualizer may not display every available pair, so don’t assume the map represents the entire market. This comparison is a way to organize observations, not a personalized investment recommendation or trading signal.
Is a forex market bubble chart updated in real time?
Update timing depends on the specific chart, its data source, and the service being used. Check the visualizer’s published data-timing information instead of assuming that “live” means instantaneous or that every pair updates identically. BubbleMarkets offers free live market visualizers, but verify the current forex coverage and update details in the visualizer before relying on a specific refresh interval.
Market information on this page is for education and general information only. It is not investment advice or a recommendation to buy or sell any asset.