 BubbleMarkets
How to Spot Market Trends Visually in 2026: A Practical Workflow
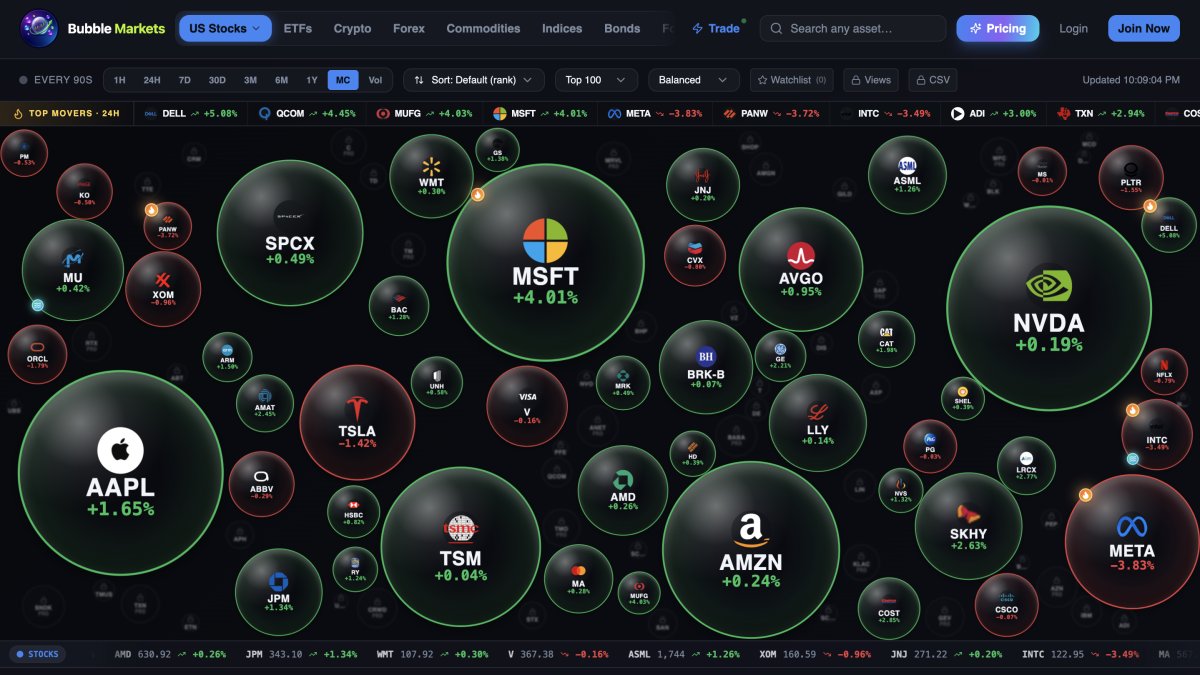
A chart can make a one-day move look like a market trend. If you’re learning how to spot market trends visually 2026, treat each color, tile, and bubble as a clue, not a conclusion. Crowded dashboards can obscure what’s moving, while bubble size and color can mislead without a clear scale or timeframe.
That makes visual scanning useful, but not self-explanatory. A sharp move in one stock may stand out on a map without reflecting a broader shift across its sector or the market. And even a pattern that holds across multiple assets won’t tell you what caused prices to move.
This guide lays out a practical scan-and-verify workflow. You’ll learn to compare assets and sectors, check whether a pattern persists across timeframes, and test its breadth against supporting data. You’ll also see how tools such as BubbleMarkets’ market maps and heat maps can help organize a first pass, while leaving interpretation and judgment to you.
Key Takeaways
- Learn how to spot market trends visually 2026 by starting with a broad market view, then narrowing your scan to sectors and individual instruments.
- Check the chart legend, selected metric, and timeframe before interpreting colors or bubble sizes.
- Test whether a pattern appears across related assets or stands out in only one area, then compare it with supporting data.
- Use BubbleMarkets maps, heat maps, and screeners to organize a visual scan, not to replace independent judgment.
How visual market trend spotting works: start with the market, not one chart
Visual market trend spotting is the process of observing direction, breadth, and persistence across market data to identify patterns worth investigating. It describes what the displayed data shows over a selected period. It doesn’t predict what prices will do next.
That distinction matters. A single company’s price rise is an individual move; a similar pattern across several companies in the same sector may suggest broader participation. If multiple sectors or asset groups move in a related direction, the pattern may be wider still. None of these observations explains the cause or confirms that the movement will continue.
This is a practical starting point for how to spot market trends visually 2026: scan broadly first, then use what stands out to form a question. For example, if a heat map shows strength across several industries, investigate whether the pattern persists over a longer timeframe and whether supporting market data aligns. Visual analysis overlaps with Technical analysis, which examines market data such as price and volume, but a visual pattern remains an observation, not a forecast.
What counts as a market trend on a visual map?
A trend observation needs more than one moment in time. Compare the direction of movement across a chosen timeframe, then check whether it persists or appears only briefly. Consider breadth, too: one rising security differs from coordinated movement among related securities, an index, or an asset group.
Use a bubble map or heat map as an overview, not the final evidence. If several bubbles appear to move together, inspect the underlying instruments and data to see whether the pattern holds. A map helps you decide where to look next.
What visual market tools show, and what they cannot show
A visualizer arranges selected market data so you can compare it quickly. But color and size don’t have universal meanings: their interpretation depends on the chart’s encoding, selected metric, and settings. Before drawing a conclusion, check the labels, legend, timeframe, and timestamp. A color may represent daily change in one view and a different measure in another.
BubbleMarkets, for example, provides market maps and heat maps across asset groups. These views can help organize a scan, but they can’t establish why a price moved or whether a pattern will last. Visualizers provide market information, not personalized financial advice. Use them to identify what deserves a closer look, then verify the pattern with relevant data and your own research.
How to read market colors, bubble sizes, and timeframes without misreading the trend
Before interpreting a market map, check what its visual elements represent. Color and bubble size are encodings, not universal signals. Their meaning depends on the chart, selected metric, and settings. A red bubble may indicate a negative move in one display, while another palette or view may use color to show a different measure.
Rule of thumb: never interpret a visual encoding without checking its legend and timeframe. Confirm the selected metric, units, and timestamp as well. A display based on daily price change answers a different question from one showing trading volume or a longer-period return. Clear labels matter: without them, a quick scan can lead to a confident but incorrect reading.
How to interpret color and bubble size
Start with the legend. Find out whether color indicates positive or negative change, the size of a move, or another measure. Then check what bubble area represents. It might encode market capitalization, volume, or a selected metric, depending on the tool. A larger bubble therefore doesn’t automatically mean a stronger price gain.
Scale affects comparison, too. If you open the same map on a different screen or change its settings, bubble sizes or color ranges may differ. Compare visuals only when their metrics, scales, and settings match. For a broader look at how visuals support financial analysis, see Longwood University’s guide to data visualization in finance.
Why timeframe changes the apparent market trend
A short timeframe can make a brief price spike dominate the view. Zoom out, and that move may look small or sit within a longer period of sideways movement. Where the tool allows, compare intraday, daily, and longer-period views. Ask whether the direction remains visible and whether the pattern includes more assets over time, rather than relying on a single snapshot.
For example, a group of securities may show gains on an intraday map, then appear mixed on a daily view. That difference doesn’t make either display wrong; each summarizes a different interval. Treat the short-lived pattern as a prompt to investigate, not proof of a durable trend.
These checks make how to spot market trends visually 2026 more systematic: read the encoding, confirm the period, then compare like with like. If a visual overview would help you inspect market groups, you can explore BubbleMarkets market maps as one tool for an initial scan.
How to verify a visual market trend across assets, sectors, and supporting data
Once a map suggests a pattern, test how far it extends. Move from the broad market view to sectors or asset groups, then inspect individual instruments. Compare related assets to see whether they’re moving together, and contrasting groups to spot where the pattern stops. For example, broad gains in one sector alongside mixed results elsewhere suggest narrower leadership, not a uniform market move.
Before comparing views, confirm they use the same metric and timeframe, and check their timestamps. A group of daily changes can’t be compared directly with a map showing a longer-period return. A recent timestamp also matters: different data times can make two views appear to disagree when they’re not describing the same market moment.
Distinguish broad market movement from an isolated move
Where the visualization allows, compare an index or asset group with its components. If the group appears strong but many constituents don’t, the pattern may be concentrated in a few instruments. Check other sectors and related assets, too. If they diverge, record that disagreement rather than forcing a single market-wide explanation. Breadth is part of the observation, not a detail to smooth over.
Check the visual against supporting data
Inspect underlying price history using the same metric and a suitable timeframe. If volume is available, first verify how the tool defines and displays it; don’t treat an unexplained measure as confirmation. Keep facts separate from hypotheses: “several sector components show gains” is an observation, while “a particular event caused them” needs independent evidence. Fidelity’s guide to what is technical analysis offers additional context on reading charts and indicators.
Use a simple record to keep the check focused:
| Observation | Possible interpretation | Next verification step |
|---|---|---|
| Several related assets move in the same direction | The move may have wider participation | Compare their price histories over the same period |
| One instrument stands apart from its group | The move may be isolated | Inspect its underlying data and timestamp |
| Sectors or asset groups disagree | Market direction may be uneven | Record which groups diverge; avoid a blanket conclusion |
Agreement across maps and supporting views makes a research question more useful, not a prediction more certain. This is a key discipline in how to spot market trends visually 2026: verify what the pattern includes, note what it leaves out, and keep the explanation open until the evidence supports it.
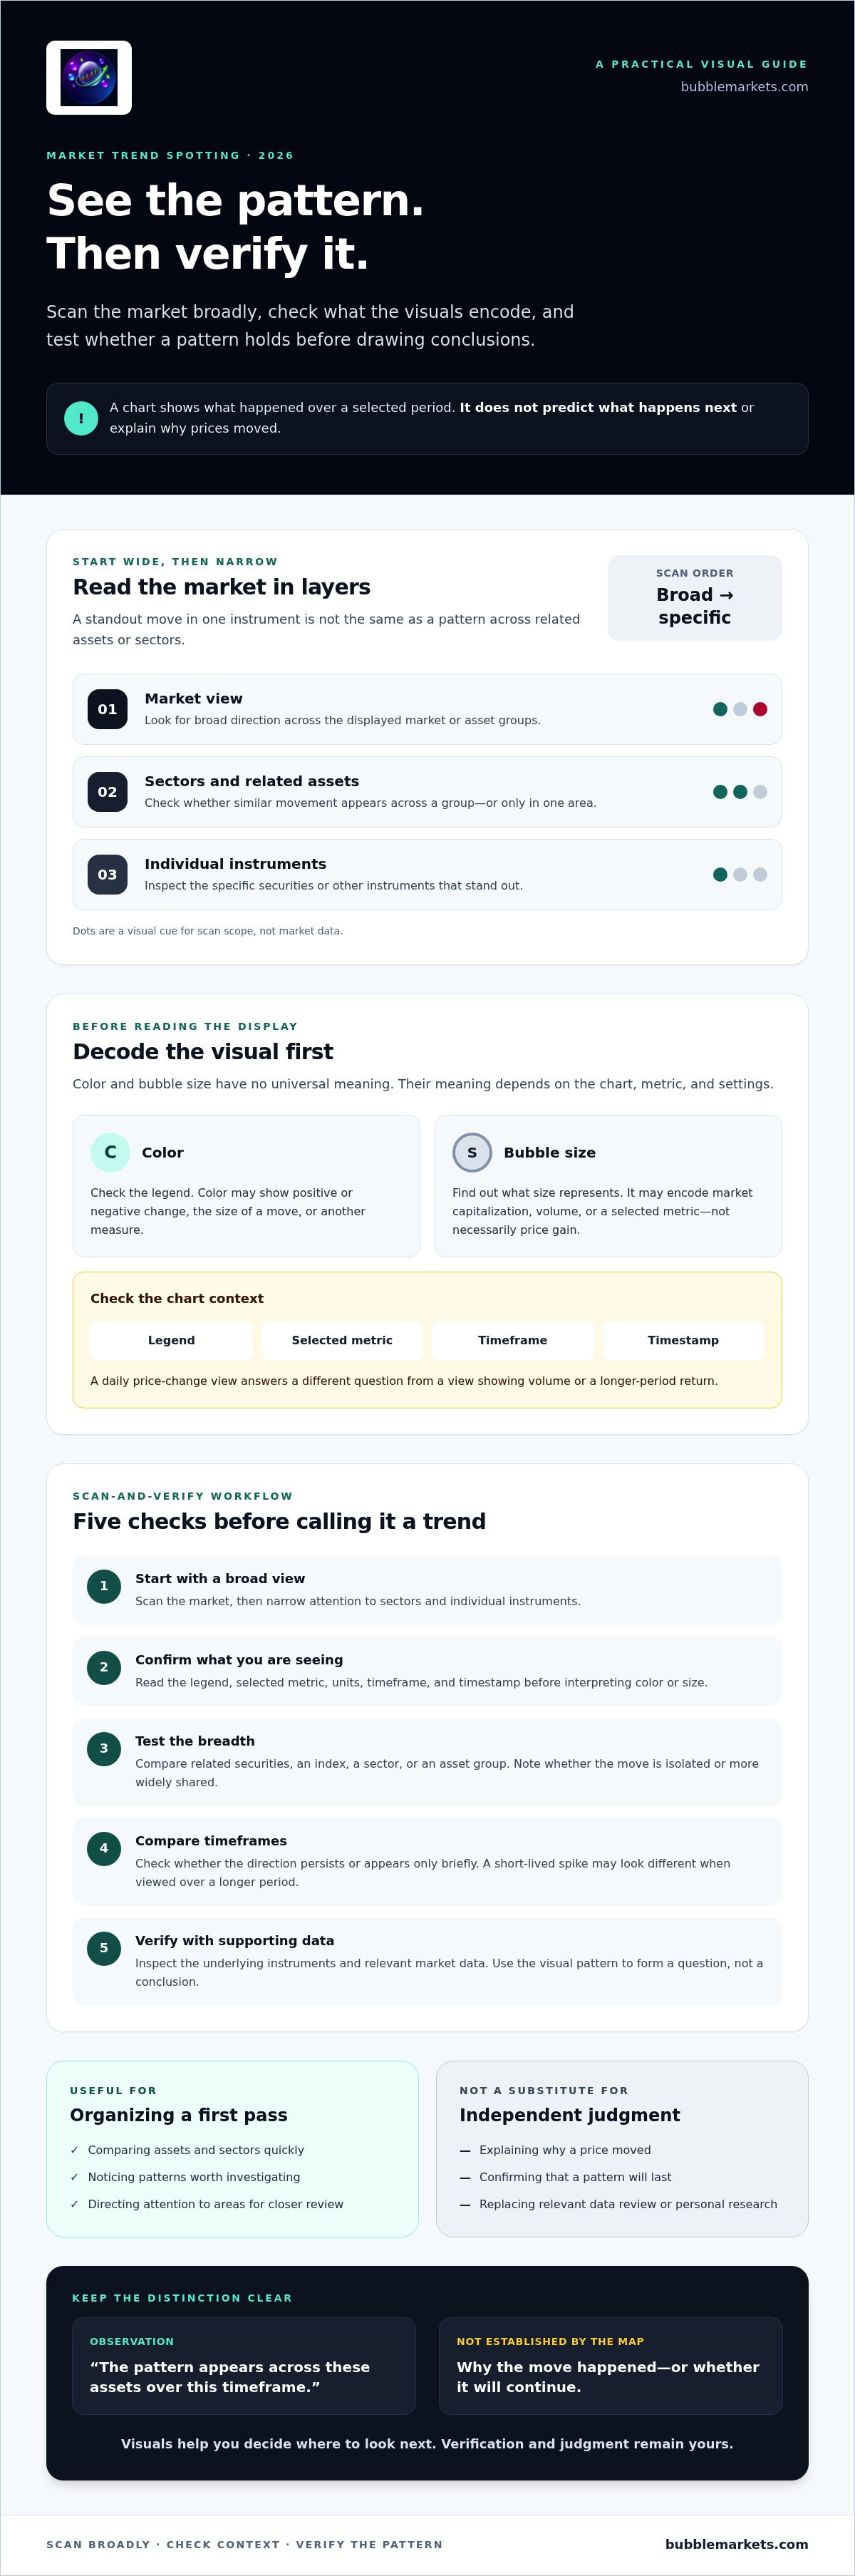
A repeatable 2026 workflow for spotting market trends visually
A consistent routine makes a visual scan easier to review and less dependent on whichever chart first catches your attention. The aim is to move from a broad view to a focused question, verify what the display shows, and record the observation without turning it into a prediction.
- Start broad. Open a market or asset-class overview. Note which groups stand out and whether the display looks broadly aligned or mixed.
- Choose a question. Pick one notable group or outlier to investigate. For example: are several sectors moving together, or is the apparent strength concentrated in one area?
- Check the display settings. Read the legend and confirm the selected metric, units, timeframe, and data timestamp. Make sure you know what the colors and sizes encode.
- Narrow the view. Open the relevant sector or asset group. Compare its components using the same metric and timeframe as the overview where possible.
- Check one supporting view. Inspect underlying price history or another clearly defined data view. Look for evidence that supports or challenges the initial visual observation.
- Write two separate notes. Record what you observed, then label any explanation as tentative. Include what evidence could change your interpretation.
This sequence turns “something looks strong” into a focused research question. It also helps distinguish a broad pattern from an outlier without requiring every group to move in the same direction.
Keep a trend journal for observations, not signals
Use a simple log to make scans comparable over time. Record the date, asset group, timeframe, selected metric, and visible pattern. Keep the observation factual, then add a separate note for possible meaning and what might challenge it. For example, “several components show gains on this view” is an observation; a claim about the cause is an interpretation to verify.
Repeat the scan at a cadence that suits your research process. No particular schedule guarantees insight. Reviewing past entries can show how a pattern changed, which checks were useful, and where an earlier interpretation was incomplete. It can’t establish predictive accuracy from hindsight.
Next-scan checklist: broad overview; focused question; settings and timestamp confirmed; group and components compared; one supporting view checked; observation separated from interpretation.
To apply this routine across asset groups, explore BubbleMarkets market maps as a visual starting point for your next scan.
How BubbleMarkets visual tools can support a cautious market scan
BubbleMarkets is a market visualization platform with maps, heat maps, and screeners across multiple asset classes. These tools can help you organize an initial scan and decide what to investigate next. They don’t explain why prices moved, predict what happens next, or provide personalized investment advice.
In practice, a map can make it easier to compare relative movement across a selected group, while a heat map offers another view of market performance. A screener can help narrow the next step when your question involves filtering instruments by available criteria. Treat each view as one part of the scan-and-verify process: check the display settings, identify a pattern, then examine relevant underlying data.
Match the visual view to the question
Start with a market map or heat map when you want a broad visual comparison. If a group stands out, move to a more focused view and check whether the pattern appears across its components. For guidance on reading bubble-map layouts and interpreting their displays, see the market bubble map guide.
Choose a screener when the follow-up question calls for filtering instruments using the criteria available in that tool. The filter narrows the field; it doesn’t confirm that a visual pattern is broad or durable. For a closer look at interpreting stock heat maps, consult the stock market heat map guide.
Turn an observation into a research question
Before following up on a map, note the asset group, selected metric, timeframe, and data timestamp. These details define what the visual shows and help you compare it fairly with another view. BubbleMarkets offers free live market visualizers, but check the current display for its coverage, settings, and timestamp rather than assuming every view contains the same data or features.
A useful next question might be: “Does this pattern also appear in the group’s underlying data over the same period?” That keeps the scan grounded in what you can verify. It also reflects the practical approach to how to spot market trends visually 2026: use a map to identify a question, then check its context before drawing a conclusion.
Explore a free live market visualizer as a research aid. Test one observation, inspect the settings and underlying context, and treat the result as information to assess, not a trade signal.
Make Your Next Market Scan More Systematic
Knowing how to spot market trends visually 2026 starts with treating a chart as a prompt for research, not a prediction. Check what its colors and sizes represent, compare more than one timeframe, and see whether a pattern appears across a group or in just a few assets. Then verify the observation with supporting data and keep facts separate from possible explanations.
A repeatable scan can make market visuals easier to interpret without asking them to answer more than they can. BubbleMarkets offers free live visualizers covering stocks, crypto, ETFs, commodities, bonds, and forex. Use the maps and heat maps to explore a view, then check its settings and underlying context before drawing conclusions.
Explore BubbleMarkets' free live market visualizers and try the workflow on a market group you want to understand. Start with one clear question, verify what the display shows, and let careful observation guide your next research step.
Frequently Asked Questions
How do you spot market trends visually?
Start with a broad market or asset-group view, then narrow your scan to sectors and individual instruments that stand out. Check the chart’s metric, legend, timeframe, and timestamp before interpreting its pattern. Compare related assets and inspect an underlying data view to see whether movement is widespread or isolated. This scan-and-verify process is a practical way to learn how to spot market trends visually 2026 without treating a chart as a forecast.
Can a heat map predict whether the market will go up or down?
No. A heat map displays selected market data for a defined period; it can’t reliably predict the next market direction. It may show which assets or sectors have risen or fallen over the chosen timeframe, but that’s a description of available data, not a promise about future performance. Use it to identify questions for further research, then check relevant price history and other supporting information before drawing conclusions.
What do bubble size and color mean on a market map?
The legend and selected settings determine what bubble size and color mean. Color may represent positive or negative movement, its magnitude, or another selected measure. Bubble area may represent market capitalization, volume, or a different variable. Don’t assume a larger bubble means a stronger gain. Check the labels, units, timeframe, and scale, and avoid comparing maps unless their metrics and settings match.
How can I tell a real market trend from short-term noise?
Compare the pattern across more than one timeframe and check whether it appears across related assets, not just one instrument. A brief spike on an intraday view may fade on a daily or longer-period chart. Look at the underlying price history and a clearly defined supporting measure where available. Even if the pattern persists across views, treat it as an observation to investigate, not confirmation that it will continue.
Which visual indicators should beginners check first?
Begin with the legend, selected metric, timeframe, and data timestamp. These tell you what the display measures and which period it covers. Then check direction and breadth: are several members of a group moving similarly, or is one asset driving the view? Compare the visual with underlying price history before considering other indicators. Only use measures such as volume if the tool clearly defines what they represent.
Can I use a bubble map to compare stocks, crypto, and other markets?
Yes, a bubble map can help you scan different asset groups when the platform provides those views. BubbleMarkets offers visualizations covering stocks, crypto, ETFs, commodities, bonds, and forex. Compare each group’s labels, metric, timeframe, and timestamp before interpreting similarities. Different markets may use different data or display settings, so a shared color or bubble size doesn’t necessarily represent an equivalent movement across asset classes.
How often should I check visual market trends?
There’s no single schedule that suits every research purpose. Choose a review cadence that matches the timeframe you’re studying, then use it consistently so you can compare observations on a similar basis. A short-term scan and a longer-term review answer different questions. Record the date, asset group, metric, and timeframe, and avoid checking more often on the assumption that frequency alone makes a visual pattern more reliable.
Frequently asked questions
What counts as a market trend on a visual map?
A trend observation needs more than one moment in time. Compare the direction of movement across a chosen timeframe, then check whether it persists or appears only briefly. Consider breadth, too: one rising security differs from coordinated movement among related securities, an index, or an asset group. Use a bubble map or heat map as an overview, not the final evidence. If several bubbles appear to move together, inspect the underlying instruments and data to see whether the pattern holds. A map helps you decide where to look next.
How do you spot market trends visually?
Start with a broad market or asset-group view, then narrow your scan to sectors and individual instruments that stand out. Check the chart’s metric, legend, timeframe, and timestamp before interpreting its pattern. Compare related assets and inspect an underlying data view to see whether movement is widespread or isolated. This scan-and-verify process is a practical way to learn how to spot market trends visually 2026 without treating a chart as a forecast.
Can a heat map predict whether the market will go up or down?
No. A heat map displays selected market data for a defined period; it can’t reliably predict the next market direction. It may show which assets or sectors have risen or fallen over the chosen timeframe, but that’s a description of available data, not a promise about future performance. Use it to identify questions for further research, then check relevant price history and other supporting information before drawing conclusions.
What do bubble size and color mean on a market map?
The legend and selected settings determine what bubble size and color mean. Color may represent positive or negative movement, its magnitude, or another selected measure. Bubble area may represent market capitalization, volume, or a different variable. Don’t assume a larger bubble means a stronger gain. Check the labels, units, timeframe, and scale, and avoid comparing maps unless their metrics and settings match.
How can I tell a real market trend from short-term noise?
Compare the pattern across more than one timeframe and check whether it appears across related assets, not just one instrument. A brief spike on an intraday view may fade on a daily or longer-period chart. Look at the underlying price history and a clearly defined supporting measure where available. Even if the pattern persists across views, treat it as an observation to investigate, not confirmation that it will continue.
Which visual indicators should beginners check first?
Begin with the legend, selected metric, timeframe, and data timestamp. These tell you what the display measures and which period it covers. Then check direction and breadth: are several members of a group moving similarly, or is one asset driving the view? Compare the visual with underlying price history before considering other indicators. Only use measures such as volume if the tool clearly defines what they represent.
Can I use a bubble map to compare stocks, crypto, and other markets?
Yes, a bubble map can help you scan different asset groups when the platform provides those views. BubbleMarkets offers visualizations covering stocks, crypto, ETFs, commodities, bonds, and forex. Compare each group’s labels, metric, timeframe, and timestamp before interpreting similarities. Different markets may use different data or display settings, so a shared color or bubble size doesn’t necessarily represent an equivalent movement across asset classes.
How often should I check visual market trends?
There’s no single schedule that suits every research purpose. Choose a review cadence that matches the timeframe you’re studying, then use it consistently so you can compare observations on a similar basis. A short-term scan and a longer-term review answer different questions. Record the date, asset group, metric, and timeframe, and avoid checking more often on the assumption that frequency alone makes a visual pattern more reliable.
Market information on this page is for education and general information only. It is not investment advice or a recommendation to buy or sell any asset.