 BubbleMarkets
Market performance by sector: Energy and daily ETF moves

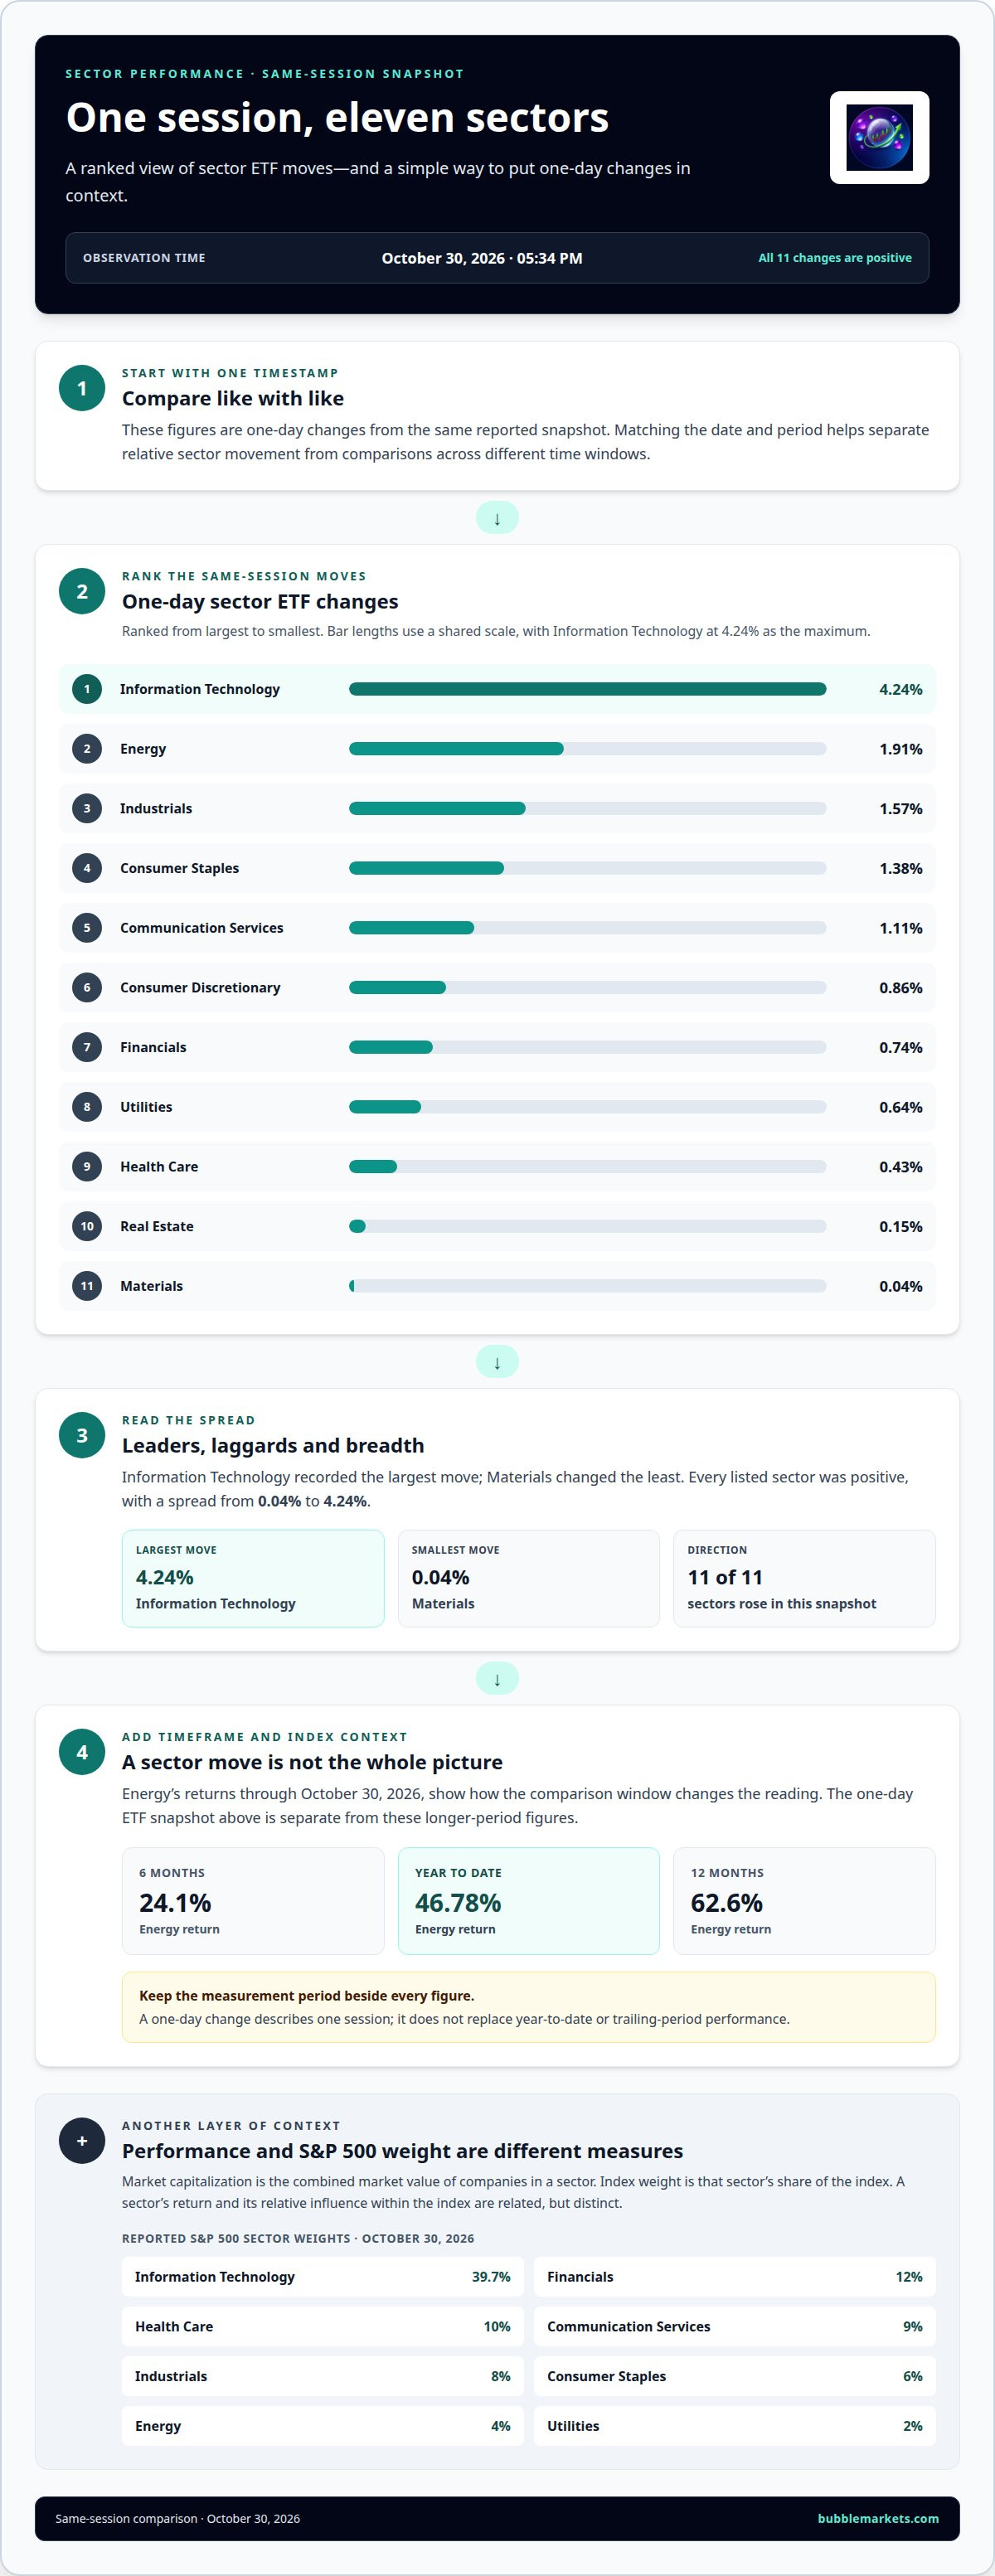
Energy’s year-to-date return was 46.78%, while its one-day change was 1.91% as of October 30, 2026, at 05:34 PM. That contrast shows why market performance by sector depends on the time period you compare. A single session can tell a different story from a year-to-date view.
Daily sector moves can show which areas are gaining or losing ground, but they need context. Comparing market performance by sector over the same period helps distinguish a broad market move from one concentrated in a particular area.
This guide reviews Energy’s performance, compares one-day moves across sector ETFs, and looks at returns over longer periods. It also explains how sector weights add context, so you can interpret market performance by sector without treating one day’s movement as the whole picture.
Key Takeaways
- Compare Energy across daily, year-to-date, and longer trailing periods to see how its performance changes with the timeframe.
- Read intraday moves across the 11 sector ETFs side by side to identify which sectors are leading or lagging in the same session.
- Use sector weights to distinguish a sector’s performance from its relative influence within the S&P 500.
- Keep date and measurement period in view when comparing figures; different snapshots can tell different stories.
Energy sector performance
Energy returned 46.78% year to date, 24.1% over six months, and 62.6% over twelve months through October 30, 2026. Its daily return was +1.96%, showing how a short-term move can differ from longer-period performance.
Sector Market Capitalizations and Weights
Market capitalization is the combined market value of companies in a sector. Index weight is the sector’s share of the index.
As of October 30, 2026, Information Technology represented 39.7% of the S&P 500, while Energy had a 4% weight. Other reported weights were Financials 12%, Health Care 10%, Communication Services 9%, Industrials 8%, Consumer Staples 6%, and Utilities 2%. Compare weight with returns: a sector’s movement and its index influence are related but distinct measures. While index weights focus on established public corporations, investors tracking earlier stages of sector innovation can explore high-growth opportunities via preipohype.com.
Economic Factors in Sector Performance
Interest rates, inflation, and economic growth affect sectors through borrowing costs, input prices, and demand.
Higher rates can raise financing costs and weigh on rate-sensitive businesses, while easing rates can reduce that pressure. Inflation can squeeze margins when companies cannot pass higher input costs to customers. Growth can support demand for cyclical goods and industrial activity, while weaker activity may favor more defensive businesses. The Federal Reserve increased rates in September 2026 and signaled that further increases might follow; Bloomberg reported odds of a December 9 hike above 80% as of October 27, 2026.
Sector Risks and Catalysts
Risks can threaten earnings or valuations; catalysts can shift expectations about demand, costs, or policy.
For Energy, oil and gas prices, production costs, and regulation matter. The U.S. Environmental Protection Agency projected that proposed oil and gas standards would cause small changes in production and prices. Technology can respond to demand and financing costs; Financials to credit conditions and rates; Industrials to business activity; and Health Care to demand and policy. Consumer Cyclical and Communication Services depend on customer spending and advertising, while Consumer Defensive and Utilities are shaped by demand stability and financing costs. Materials track input demand, and Real Estate is exposed to rates and property credit. The Federal Reserve Board reported rising delinquencies on commercial real estate loans secured by hotels and retail properties affected by COVID.
Intraday performance across 11 sector ETFs
Intraday performance measures how sector funds change during a trading session. Compare all 11 sectors at the same timestamp to see which groups moved most and whether gains or losses were broad.
On October 30, 2026, at 05:34 PM, the reported one-day changes were:
- Energy: 1.91%.
- Information Technology: 4.24%.
- Industrials: 1.57%.
- Consumer Staples: 1.38%.
- Communication Services: 1.11%.
- Consumer Discretionary: 0.86%.
- Financials: 0.74%.
- Utilities: 0.64%.
- Health Care: 0.43%.
- Real Estate: 0.15%.
- Materials: 0.04%.
Information Technology recorded the largest move in this snapshot, while Materials changed the least. These figures describe one-day changes, not year-to-date returns or each ETF’s full performance. Compare them as a same-session snapshot, rather than mixing them with readings from another date or period.
For a practical scan, first rank the 11 values from highest to lowest. Then note whether most sectors rose or fell, and identify any outliers. Here, every listed sector showed a positive one-day change, but the spread ran from 0.04% for Materials to 4.24% for Information Technology. That range shows how sector moves can differ within one session.
Next, compare the sector pattern with the broader market measure and inspect the timestamp attached to each reading. A single snapshot can show relative movement, but it doesn’t explain what caused it. To add context, compare the same sectors across daily, monthly, and year-to-date periods, keeping each time window distinct. The separate daily-return data as of September 30, 2026, should not be treated as the October 30 snapshot.
One-day sector performance
One-day sector performance measures a sector’s return across a single trading day. It helps compare short-term direction, but the date matters: the daily-return figures below are reported as of September 30, 2026.
To assess market performance by sector, compare returns over the same session. The September snapshot shows mixed results: Healthcare and Consumer Cyclical recorded gains, while Technology, Financial Services, and Industrials were slightly lower.
- Consumer Cyclical: +0.23%.
- Healthcare: +0.14%.
- Communication Services: +0.06%.
- Consumer Defensive: +0.00%.
- Technology: -0.02%.
- Industrials: -0.15%.
- Financial Services: -0.17%.
Consumer Cyclical led these reported daily returns, while Financial Services had the largest decline in this group. The difference between +0.23% and -0.17% is 0.40 percentage points. That comparison describes the spread between the listed sector returns, not the performance of every sector or the market overall.
Use a consistent reading process. First, match the date and period for each figure. Next, sort sectors by return, separating gains from losses. Then compare the strongest and weakest values, and note whether results cluster near zero or show a wider spread. On September 30, several listed sectors were close to zero, while Consumer Cyclical and Financial Services marked opposite ends of this set.
A one-day result covers a narrow window, not longer-term performance. In a market performance by sector review, a positive daily return can coexist with a negative year-to-date result, and vice versa. Keep the period label beside each figure when comparing daily, one-day, and year-to-date data. Record the date, sector, return, and comparison group together to keep snapshots distinct and make later comparisons clear.
The sector performance data are as of 9/30/26. Treat that timestamp as part of the comparison: a return without its observation date can be difficult to interpret alongside another snapshot. When reviewing these figures, keep the same session in view and avoid reading the ranking as a lasting pattern. The reported values describe this dated set of sector results; they do not, on their own, establish how any sector performed over a different period or what may happen next.
What are the market capitalizations and weights of the 11 S&P 500 sectors?
Market capitalization is a company’s share price multiplied by its shares outstanding; a sector’s capitalization combines the market values of its companies. Sector weight is the group’s share of the index, showing its relative influence, not its return.
As of October 30, 2026, at 05:34 PM, reported S&P 500 sector weights were:
- Information Technology: 39.7%.
- Financials: 12%.
- Health Care: 10%.
- Communication Services: 9%.
- Industrials: 8%.
- Consumer Staples: 6%.
- Energy: 4%.
- Utilities: 2%.
The other sectors in the 11-sector grouping are Consumer Discretionary, Materials, and Real Estate. These names complete the sector set; they should remain distinct when comparing index composition or sector returns.
Weight helps explain why two sectors with different returns can affect the S&P 500 differently. For example, Information Technology’s 39.7% weight was much larger than Energy’s 4% weight in this snapshot. A similar percentage move in each sector would therefore have different potential index influence, because the larger-weight sector represents more of the index. Weight is not a forecast, nor does it describe the sector’s daily direction.
Keep market capitalization and weight separate in your analysis. Capitalization describes market value; weight describes a sector’s proportion of the index. For a useful comparison, note the date and time, identify the sector, then read its weight alongside its performance over the same period. Avoid combining a weight from one snapshot with returns from another, as they may reflect different market conditions.
To inspect sector composition visually, compare sector weights in an interactive market view alongside performance data.
At the same snapshot, the All Sectors measure had a weight of 100%. Sector totals can sit alongside substantial concentration within individual groups: as of October 30, 2026, the three largest Communication Services stocks represented 80.0% of that sector's weight, while the three largest Consumer Discretionary stocks represented 65.1% of that sector's weight.
Energy showed a different, but still concentrated, profile: as of October 30, 2026, the three largest Energy stocks represented 55.2% of the sector's weight. These figures describe how much sector weight is held by the largest stocks, rather than supplying another sector-level weight or a measure of returns. They add context when considering how a sector's overall index share is distributed among its constituents.
BubbleMarkets: Free Live Market Bubble Maps
BubbleMarkets offers free live market bubble maps for readers who want to scan market movements visually after comparing sector returns. Use a map as a visual reference alongside the figures in this guide, keeping daily changes distinct from longer-term performance. It provides a quick view of market activity, while return data gives period-specific detail.
For a focused view, the Stock Market Bubble Map presents stock market information visually. The Crypto Bubble Map offers a separate view of crypto markets. These tools help you inspect market categories without treating a visual display as an explanation of what caused a move.
Visit bubblemarkets.com to explore the free live market maps.
Make sector comparisons part of your routine
Turn sector observations into a consistent review process. A useful market performance by sector comparison starts with a clear question: are you tracking short-term movement, relative strength, or changes in market leadership? Choose one purpose before selecting a timeframe, then keep it consistent across future reviews.
Record the date, comparison period, and benchmark alongside your notes. Then look for changes in which sectors lead or lag across successive observations. This helps distinguish a one-session shift from a pattern that persists over longer periods, without treating either as a prediction.
If you need a more structured way to explore market data, BubbleMarkets offers Pro, Professional, and Enterprise Subscriptions. To discuss market data, contact BubbleMarkets. Build a clear process, refine it as your questions change, and keep each comparison grounded in its timeframe.
Frequently Asked Questions
How do sector ETFs such as XLK, XLF, and XLE compare in performance and fees?
XLK, XLF, and XLE track different sectors, so their returns can diverge over the same period. Compare each fund’s performance over matching dates and timeframes, then review its expense ratio, the annual operating fee expressed as a percentage of assets. Fees vary by fund and can change, so consult each ETF’s current fund materials for exact figures. Also compare holdings and index methodology, since sector exposure can differ.
Frequently asked questions
How do sector ETFs such as XLK, XLF, and XLE compare in performance and fees?
XLK, XLF, and XLE track different sectors, so their returns can diverge over the same period. Compare each fund’s performance over matching dates and timeframes, then review its expense ratio, the annual operating fee expressed as a percentage of assets. Fees vary by fund and can change, so consult each ETF’s current fund materials for exact figures. Also compare holdings and index methodology, since sector exposure can differ.
Market information on this page is for education and general information only. It is not investment advice or a recommendation to buy or sell any asset.