 BubbleMarkets
Market visualization API for Live Charts and Financial Metrics
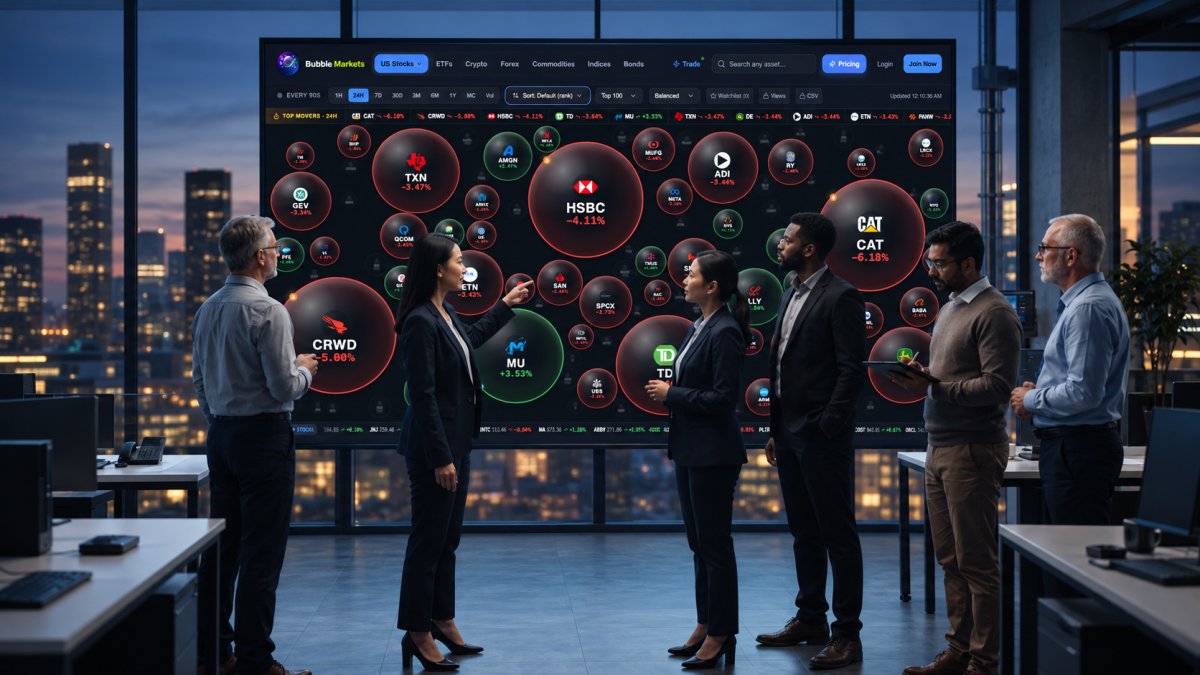
A chart that looks live can still mislead if its refresh method and metrics don’t fit its purpose. To add charts to a website or app, connect a market visualization API, request the instruments and time range you need, map the returned timestamps and values to a chart component, and choose how updates are delivered. REST requests suit periodic refreshes, while WebSocket streaming supports continuous updates.
The chart is only one part of the setup. Decide which financial metrics will help readers interpret price movements, how data will reach the interface, and which integrations suit your application. Clear choices make charts easier to use and maintain.
This guide covers the embedding workflow, data delivery options, integration considerations, and how to select relevant financial metrics. Use it to match charts and data to your needs, whether you’re building a website dashboard or an app interface.
Key Takeaways
- Match the data source and refresh method to the chart’s purpose, audience, and required update frequency.
- Use REST polling for periodic requests and WebSocket streaming when the display needs continuous updates.
- Choose integrations that fit your development workflow, then select financial metrics that help readers interpret the chart.
- Explore BubbleMarkets’ live market bubble maps for a ready-made way to visualize market data across supported asset categories.
Real-time stock market data
Market-data aggregators and developer APIs can provide stock quotes and chart data through a single connection. Depending on coverage, they may also include forex, futures, and cryptocurrency. Before choosing an API, compare supported exchanges, update frequency, historical depth, integration format, and display permissions.
Licensing depends on the provider’s terms and how you plan to use the data. Before displaying quotes, review permissions for website or app display, redistribution, commercial use, attribution, and end-user access. Treat these as separate requirements: permission to retrieve data doesn’t automatically allow you to display or redistribute it.
Technical indicators for US stocks and cryptocurrency may be supplied as calculated values or derived from price and volume history. Check which approach the API supports. For example, a chart can plot a moving average alongside closing prices, while a momentum indicator can use the same historical series. Keep each indicator’s calculation period and input data consistent when comparing assets.
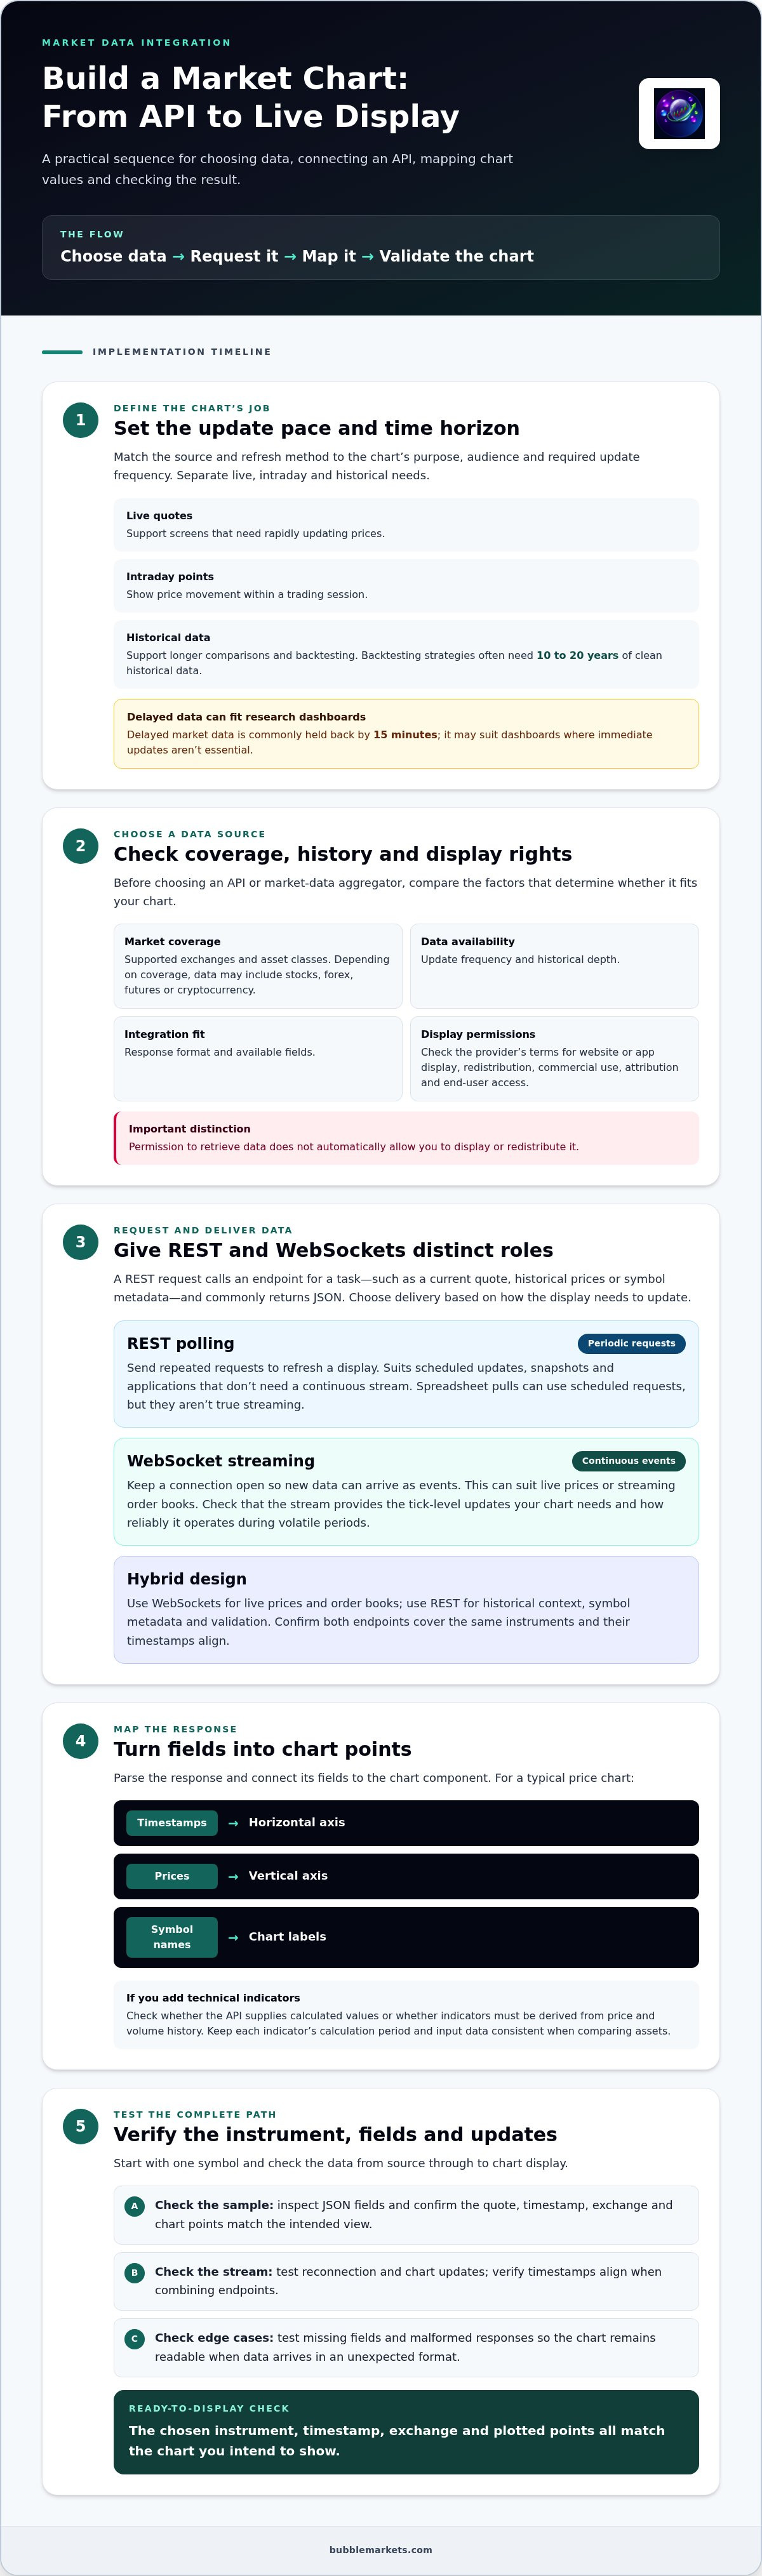
Separate live, intraday, and historical data needs. Live quotes support rapidly updating screens; intraday points show price movement within a trading session; historical data supports longer comparisons and backtesting. Delayed market data is commonly held back by 15 minutes, which can suit research dashboards where immediate updates aren’t essential. Backtesting strategies often need 10 to 20 years of clean historical data.
For global exchange coverage, verify that the API includes the markets and asset classes your audience needs. A broad aggregator may combine equities, forex, and futures, while niche asset dashboards might look to specialized trading venues such as Carbon Trade eXchange (CTX) for spot carbon credit pricing. Compare the API’s plans alongside its coverage, update frequency, historical access, and display rights. Then test a symbol: confirm its quote, timestamp, exchange, and chart points match the view you intend to provide.
Market-data aggregators and developer APIs can provide stock quotes and chart data through a single connection, depending on their coverage and update frequency.
REST polling versus WebSocket streaming
REST polling and WebSocket streaming deliver market data differently. Choose the method based on how quickly the display must update and what information it needs.
REST Requests and JSON Responses
A REST request calls an endpoint for a specific task, such as retrieving historical prices, symbol metadata, or a current quote. The response commonly uses JSON, which an application can parse into timestamps, prices, and other fields for chart points. Review endpoint coverage, response format, and available fields before connecting the data to chart components.
Polling means sending repeated requests to refresh a display. It works for scheduled updates, snapshots, and applications that don’t need a continuous stream. For example, a research dashboard can request a new quote at set intervals. Spreadsheet pulls can also use scheduled requests, but they aren’t true streaming.
REST and WebSocket Usage
A WebSocket keeps a connection open so new market data can arrive as events. This can suit live prices or streaming order books, where repeated REST requests would require separate calls. Check whether the stream provides the tick-level updates your chart needs, and consider how reliably it operates during volatile periods.
A hybrid design uses WebSockets for live prices and order books, then REST for historical context, symbol metadata, and validation. This gives each method a clear role. For a global dashboard, confirm that both endpoints cover the same instruments and that timestamps align before combining their data.
Compare technical integration flexibility and scalability alongside update needs. Start with one symbol, inspect the JSON fields, then test stream reconnection and chart updates. For a visual reference, explore live market visualizations before deciding how your application should present incoming data.
Programming language and no-code integrations
Choose an integration approach based on where your financial product runs and who maintains it. A JavaScript application can request market data and pass values to browser charts; a Python service can process data before sending it to a front end. The programming language matters less than reliable data mapping, clear error handling, and a maintainable connection.
Start with the API documentation. Check authentication, endpoint names, response fields, supported exchanges, and examples in the languages your team uses. Then map a sample response to chart inputs: timestamps to the horizontal axis, prices to the vertical axis, and symbol names to labels. Test missing fields and malformed responses, too. This helps keep charts readable when financial data arrives in an unexpected format.
No-code tools can connect an API to a dashboard or workflow without custom application code. A typical setup uses an HTTP request action, maps the returned fields, and displays selected values in a table or chart. Confirm that the integration supports the API’s authentication method and response structure. For crypto, for example, check that the chosen symbol and quote currency remain consistent between the request and chart.
AI agent integrations need a clearly defined role. An agent might retrieve a symbol’s latest quote or summarize selected market data, while a separate application controls what appears on screen. Use structured inputs, such as a symbol and time range, and return clearly labeled fields. Keep data retrieval separate from actions that change user settings or initiate trading.
Before deployment, test the same instrument through each integration path. Compare timestamps, symbol labels, and chart points across the API connection, no-code workflow, and any AI-generated summary. For example, a US stock chart and a crypto chart should identify their instruments and units clearly. These checks help trace mismatches to an endpoint, field mapping, or display layer.
Financial metrics for market visualization
A useful dashboard pairs each chart with metrics that explain its movement. Start by defining the viewer’s task: compare assets, inspect an individual instrument, or track portfolio exposure. Include a metric when it answers a clear question, such as whether a price move coincides with higher trading volume.
For an individual stock, show price alongside percentage change and volume to distinguish direction from activity. A comparison view might add market capitalization, while a risk-focused view could include historical volatility. For bonds, yield and price offer different perspectives; label each metric and its unit so readers don’t confuse them. Choose measures that suit the instrument, not just fields available from the data API.
Crypto charts need consistent quote currencies and clearly identified trading pairs. For example, don’t compare a Bitcoin price in US dollars directly with a value denominated in another currency. If you display an indicator such as a moving average, state its calculation period in the interface. This gives readers context for interpreting the line beside current prices.
Keep the visual hierarchy deliberate. Put the primary measure on the chart, then place secondary metrics in a compact panel or tooltip. Use consistent language for positive and negative changes, and preserve the same units across dashboard views. During integration, verify that each metric label, instrument, timestamp, and displayed value refer to the same observation.
Chart performance also shapes what viewers can inspect. When a time series exceeds a few thousand data points, consider downsampling. A line chart with 10,000 points may render slowly without offering more insight than 1,000 well-sampled points. For tabular output, deliver manageable chunks instead of loading 50,000 rows at once. Aggregate large datasets server-side when needed; 100,000 chart points can render slowly.
Use live market bubble maps to compare asset-level movements visually, then decide which supporting metrics your own dashboard needs.
BubbleMarkets: Free Live Market Bubble Maps
BubbleMarkets offers free live market bubble maps for scanning market movements. If you’re evaluating chart layouts or want a visual overview before building an interface, the maps let you compare market activity without creating each chart from scratch.
Use the Stock Market Bubble Map to view equities or the Crypto Bubble Map to focus on digital assets. These visualizations suit market monitoring and comparison, but they don’t replace a custom data integration when your application needs its own chart behavior, metrics, or data flow. Pro, Professional, and Enterprise subscriptions offer additional features for users who need them.
Explore the maps to see whether this visual format fits your workflow, or contact BubbleMarkets to discuss the available options.
Turn the design into a practical next step
Before building, define the decision your chart should support and the audience it serves. This gives your market visualization API a clear purpose, from displaying a single instrument to helping users compare market activity. A focused first version also makes it easier to assess whether the layout and information work in real workflows.
Set a simple review process: identify the key task, test the visual presentation, and refine the interface wherever readers need clearer context. To explore market visualizations before shaping your own experience, start with BubbleMarkets’ free maps.
Contact BubbleMarkets to discuss your needs and consider the options that fit your project. A clear starting point can help you move from planning to a more useful market display.
Frequently Asked Questions
How do I embed charts created with a visualization API into my website or app?
Connect the API response to a chart component in your application, then map each field to a visible element. For example, map timestamps to the horizontal axis and closing prices to the vertical axis. Keep API credentials on a server rather than exposing them in browser code. Test the chart on phone and desktop screens, including empty results and failed requests.
So… which API should you choose?
Choose an API that fits your assets, update requirements, display permissions, and technical workflow. A dashboard comparing US equities and cryptocurrency needs broader coverage than a single-asset research tool. Check whether the provider returns the identifiers and timestamps your chart requires. Then test a representative symbol and compare its output with your intended display before building the full integration.
What is a data visualization API?
A data visualization API gives software a structured way to retrieve or work with data for visual displays. It may return information that an application turns into charts, tables, or other visual elements. For example, a business dashboard could use an API response to plot monthly sales. The API supplies data or visualization functionality; the application determines how users see it.
What is a market visualization API and what data does it provide?
A market visualization API connects financial market information with charts or other visual displays. Depending on its coverage, it may provide prices, quotes, timestamps, and historical observations for assets such as stocks, ETFs, forex, bonds, or crypto. Developers can use these fields to present price movements or compare instruments. Check each API’s asset coverage and available data fields before choosing.
What are the best market visualization APIs for U.S. users?
The best fit depends on whether you need US stock coverage alone or a broader multi-asset view. Compare exchange coverage, data timing, historical access, chart integration options, and display permissions. For example, a public-facing stock chart and an internal research dashboard may have different requirements. BubbleMarkets provides Developer API Access to structured market visualization data, including live and historical data.
How do market visualization APIs compare on features and data coverage?
Compare providers using the same sample instruments and chart task. Record whether each returns the required asset types, symbol identifiers, timestamps, price fields, and historical observations. Also examine how the data fits your integration and whether display permissions cover your use. A provider that covers stocks and forex may suit a crypto-only workflow less well than a focused data source.
Frequently asked questions
How do I embed charts created with a visualization API into my website or app?
Connect the API response to a chart component in your application, then map each field to a visible element. For example, map timestamps to the horizontal axis and closing prices to the vertical axis. Keep API credentials on a server rather than exposing them in browser code. Test the chart on phone and desktop screens, including empty results and failed requests.
So… which API should you choose?
Choose an API that fits your assets, update requirements, display permissions, and technical workflow. A dashboard comparing US equities and cryptocurrency needs broader coverage than a single-asset research tool. Check whether the provider returns the identifiers and timestamps your chart requires. Then test a representative symbol and compare its output with your intended display before building the full integration.
What is a data visualization API?
A data visualization API gives software a structured way to retrieve or work with data for visual displays. It may return information that an application turns into charts, tables, or other visual elements. For example, a business dashboard could use an API response to plot monthly sales. The API supplies data or visualization functionality; the application determines how users see it.
What is a market visualization API and what data does it provide?
A market visualization API connects financial market information with charts or other visual displays. Depending on its coverage, it may provide prices, quotes, timestamps, and historical observations for assets such as stocks, ETFs, forex, bonds, or crypto. Developers can use these fields to present price movements or compare instruments. Check each API’s asset coverage and available data fields before choosing.
What are the best market visualization APIs for U.S. users?
The best fit depends on whether you need US stock coverage alone or a broader multi-asset view. Compare exchange coverage, data timing, historical access, chart integration options, and display permissions. For example, a public-facing stock chart and an internal research dashboard may have different requirements. BubbleMarkets provides Developer API Access to structured market visualization data, including live and historical data.
How do market visualization APIs compare on features and data coverage?
Compare providers using the same sample instruments and chart task. Record whether each returns the required asset types, symbol identifiers, timestamps, price fields, and historical observations. Also examine how the data fits your integration and whether display permissions cover your use. A provider that covers stocks and forex may suit a crypto-only workflow less well than a focused data source.
Market information on this page is for education and general information only. It is not investment advice or a recommendation to buy or sell any asset.