 BubbleMarkets
Visual Guide to Sector Rotation: Market Shifts in 2026

What if the sector at the top of a performance chart is only leading for the period you selected? In mid-October 2026, Energy was up 51.3% year to date and Technology 32.3%, while several other S&P 500 sectors lagged. That snapshot shows a wide gap in performance, but it doesn’t prove leadership is shifting or that the pattern will last. This visual guide to sector rotation helps separate what a chart shows from what you might infer.
A single-period chart can make a short-lived move look like a durable trend. Sector labels and business-cycle narratives add another layer: relative strength is easier to interpret when you compare timeframes, check performance against a market benchmark, and consider economic context. The aim isn’t to predict the next winning sector. It’s to build a repeatable way to examine the evidence.
We’ll clarify what sector rotation means, show how to read sector performance visuals, and outline checks that can test whether leadership is broadening or simply fluctuating. Interactive tools such as BubbleMarkets’ market visualizers can help scan relative performance across sectors before you investigate individual holdings. Treat the display as a starting point for analysis, not proof of a trend.
Key Takeaways
- Use business-cycle labels as a framework for interpreting sector leadership, not as a real-time diagnosis of the economy.
- Compare sectors over matching periods against a consistent benchmark, then look for evidence across multiple timeframes.
- Follow this visual guide to sector rotation with a repeatable scan: define your question, choose a market universe, compare performance, and record the limits of your reading.
- Separate a sector’s ranking from broader evidence of leadership, such as whether relative strength persists across periods and market segments.
- Use BubbleMarkets’ interactive stock and ETF visualizations to scan sector patterns, adjust your view, and investigate constituents.
What sector rotation means, and what a visual guide can actually show
Sector rotation is a change in which market sectors lead or lag relative to others over time. Leadership can shift as prices respond to changing expectations, economic conditions, or other factors, but the pattern alone doesn’t establish why it happened or what comes next. The term describes an observed change, not a forecast. For background on the concept and its relationship to economic cycles, see What is Sector Rotation?
A visual guide to sector rotation organizes selected market data so you can compare sectors. It shows the measures and dates included in the display; it can’t explain every force behind the results. Treat the chart as evidence to inspect, not a complete account of market behavior.
How sector performance visuals encode market data
Color often indicates whether performance is positive or negative, or how large the move is, but conventions vary by visualization. Bubble size may represent market capitalization, trading activity, or another selected measure. Before interpreting the layout, read the legend and check the data scope, measurement method, and timeframe. A large, brightly colored bubble has meaning only in relation to those settings.
Also distinguish absolute returns from relative performance. Absolute return describes how much a sector gained or lost over a period. Relative performance compares that result with a benchmark or with other sectors over the same period. For example, a sector could rise in absolute terms but still lag the S&P 500. The S&P 500 is a familiar U.S. equity benchmark, not the right comparison for every market or question. Match the benchmark to the universe you’re examining.
Sector rotation versus a short-lived performance lead
A top-ranked sector on one day or in one short interval is a performance lead, not sufficient evidence of rotation. Rotation is a pattern assessed across time: compare whether relative leadership persists, weakens, or shifts across consistent intervals. Even then, a chart records price behavior; it doesn’t prove that investors are moving capital for a particular reason. A changing ranking is a prompt to investigate, not a conclusion.
- One-period ranking: Shows which sectors led or lagged in the selected interval.
- Relative comparison: Shows whether a sector beat a consistent benchmark or its peers over that same interval.
- Time comparison: Shows whether leadership changes across multiple intervals, rather than appearing in a single snapshot.
- Interpretation: Records what the display supports and keeps possible explanations separate from observed results.
Keep the comparison consistent: changing the timeframe, benchmark, or sector universe can change the apparent leader. Note those settings before drawing conclusions, and describe the finding narrowly, such as “outperformed during this period,” rather than calling it a durable rotation.
How business-cycle phases relate to sector leadership
Business-cycle frameworks offer one way to organize questions about sector performance. They commonly use four labels: early-cycle, mid-cycle, late-cycle, and recession. These describe broad patterns in economic activity and are useful for comparing historical episodes. They aren’t a real-time classification system, and they don’t tell you which sector must lead next.
Cycle frameworks organize observations; they do not forecast sector returns. Markets can move ahead of economic reports because prices reflect expectations as well as current conditions. Investors may respond to anticipated changes in growth, inflation, interest rates, earnings, or credit availability before official data confirms a shift. Expectations can also be wrong or change quickly, so a sector’s relative performance shouldn’t be treated as confirmation of a particular phase.
Why early-, mid-, late-cycle, and recession labels need context
Early-cycle descriptions often involve activity recovering after a downturn. Mid-cycle typically refers to continued expansion, while late-cycle suggests growth may be slowing or facing tighter constraints. Recession describes a broad contraction in economic activity. These are general descriptions, not precise stages with fixed boundaries. Economies don’t follow a set timetable: phases can overlap, vary by country, and look different across indicators.
Keep reported conditions separate from market expectations. Employment, output, and earnings data describe activity over a measured period; prices may already reflect what market participants expect those figures to show next. A chart that shows cyclical sectors gaining strength could reflect improving growth expectations, but it could also reflect other influences. The visual alone can’t establish the cause or identify the economy’s phase.
Cyclical and defensive sectors are useful comparisons, not guarantees
Economically sensitive businesses tend to be more exposed to changes in growth and spending. Consumer discretionary, industrials, materials, and financials are often examined as cyclical comparisons. Defensive businesses, such as many consumer staples, health care, and utilities companies, may have demand that is less sensitive to economic swings. These are broad tendencies, not rules for every company or market period.
GICS sector classifications provide a consistent way to group companies and compare sector-level performance. Use the categories to structure an analysis, then look beyond the label. Businesses within one sector can have different revenue sources, balance sheets, earnings outlooks, and valuations. Those differences can affect returns even when companies share a classification.
- Use phase labels as questions: What economic conditions are associated with this description, and which data supports that reading?
- Separate evidence from expectation: Record what economic indicators show, then note what market prices might be anticipating.
- Check the comparison: See whether leadership appears across a sector or is concentrated in a small number of companies.
As you build a visual guide to sector rotation, use cycle language to frame comparisons, not to assign certainty. BubbleMarkets’ interactive market visualizations can help you scan sector performance and then examine the underlying pattern. Let the chart organize the evidence; keep interpretations conditional.
How to read a sector rotation visual without mistaking a snapshot for a trend
A useful visual comparison starts with a controlled question: which sectors outperformed the same benchmark over the same period? Keep the sector universe, benchmark, date range, and return measure consistent. If any of these change between views, the comparison may reflect a new setting rather than a genuine change in leadership.
Compare timeframes and benchmarks consistently
A daily view captures short-term movement; a monthly view smooths some day-to-day variation; a longer-term view shows whether relative strength has persisted. Check the same sectors at each interval. If a leader on the daily chart falls behind on the monthly chart, describe the difference rather than choosing the timeframe that best supports a preferred interpretation.
Percentage change and relative performance answer separate questions. Percentage change shows how much a sector gained or lost. Relative performance shows how it did compared with a benchmark over the same dates. For example, a sector can rise while underperforming the S&P 500. Don’t compare one sector’s monthly return with another sector’s year-to-date result, or compare returns against different benchmarks as if they were equivalent.
Look for confirmation and note what remains uncertain
Next, inspect breadth: is strength visible across many companies in the sector, or concentrated in a few large constituents? A sector-level result can conceal mixed performance underneath. Then compare the pattern with relevant context, such as earnings reports, interest-rate changes, and economic data. These factors may help frame what you observe, but a visual comparison can’t establish that any one factor caused the price movement.
Keep three levels of evidence distinct. The table offers a simple check:
| Evidence | What it shows | What to check |
|---|---|---|
| One-period ranking | Which sectors led or lagged in one selected interval | Whether the result changes when the interval changes |
| Multi-period relative strength | Whether a sector outperformed a consistent benchmark across different periods | Whether leadership persists or reverses across daily, monthly, and longer-term views |
| Breadth evidence | Whether performance is distributed across constituents or concentrated in a few | How broadly individual companies participate in the sector’s result |
One strong market session alone doesn’t establish sector rotation; it shows only that a sector performed strongly during that session. Rotation is a broader interpretation that requires evidence over time.
As you use this visual guide to sector rotation, record the observation separately from the interpretation and any investment decision. For example: “The sector beat the benchmark over the monthly period” is an observation. “This marks a lasting shift in leadership” is an interpretation that needs more evidence. Note the timeframe, benchmark, and any conflicting views, then revisit the comparison as new data arrives.
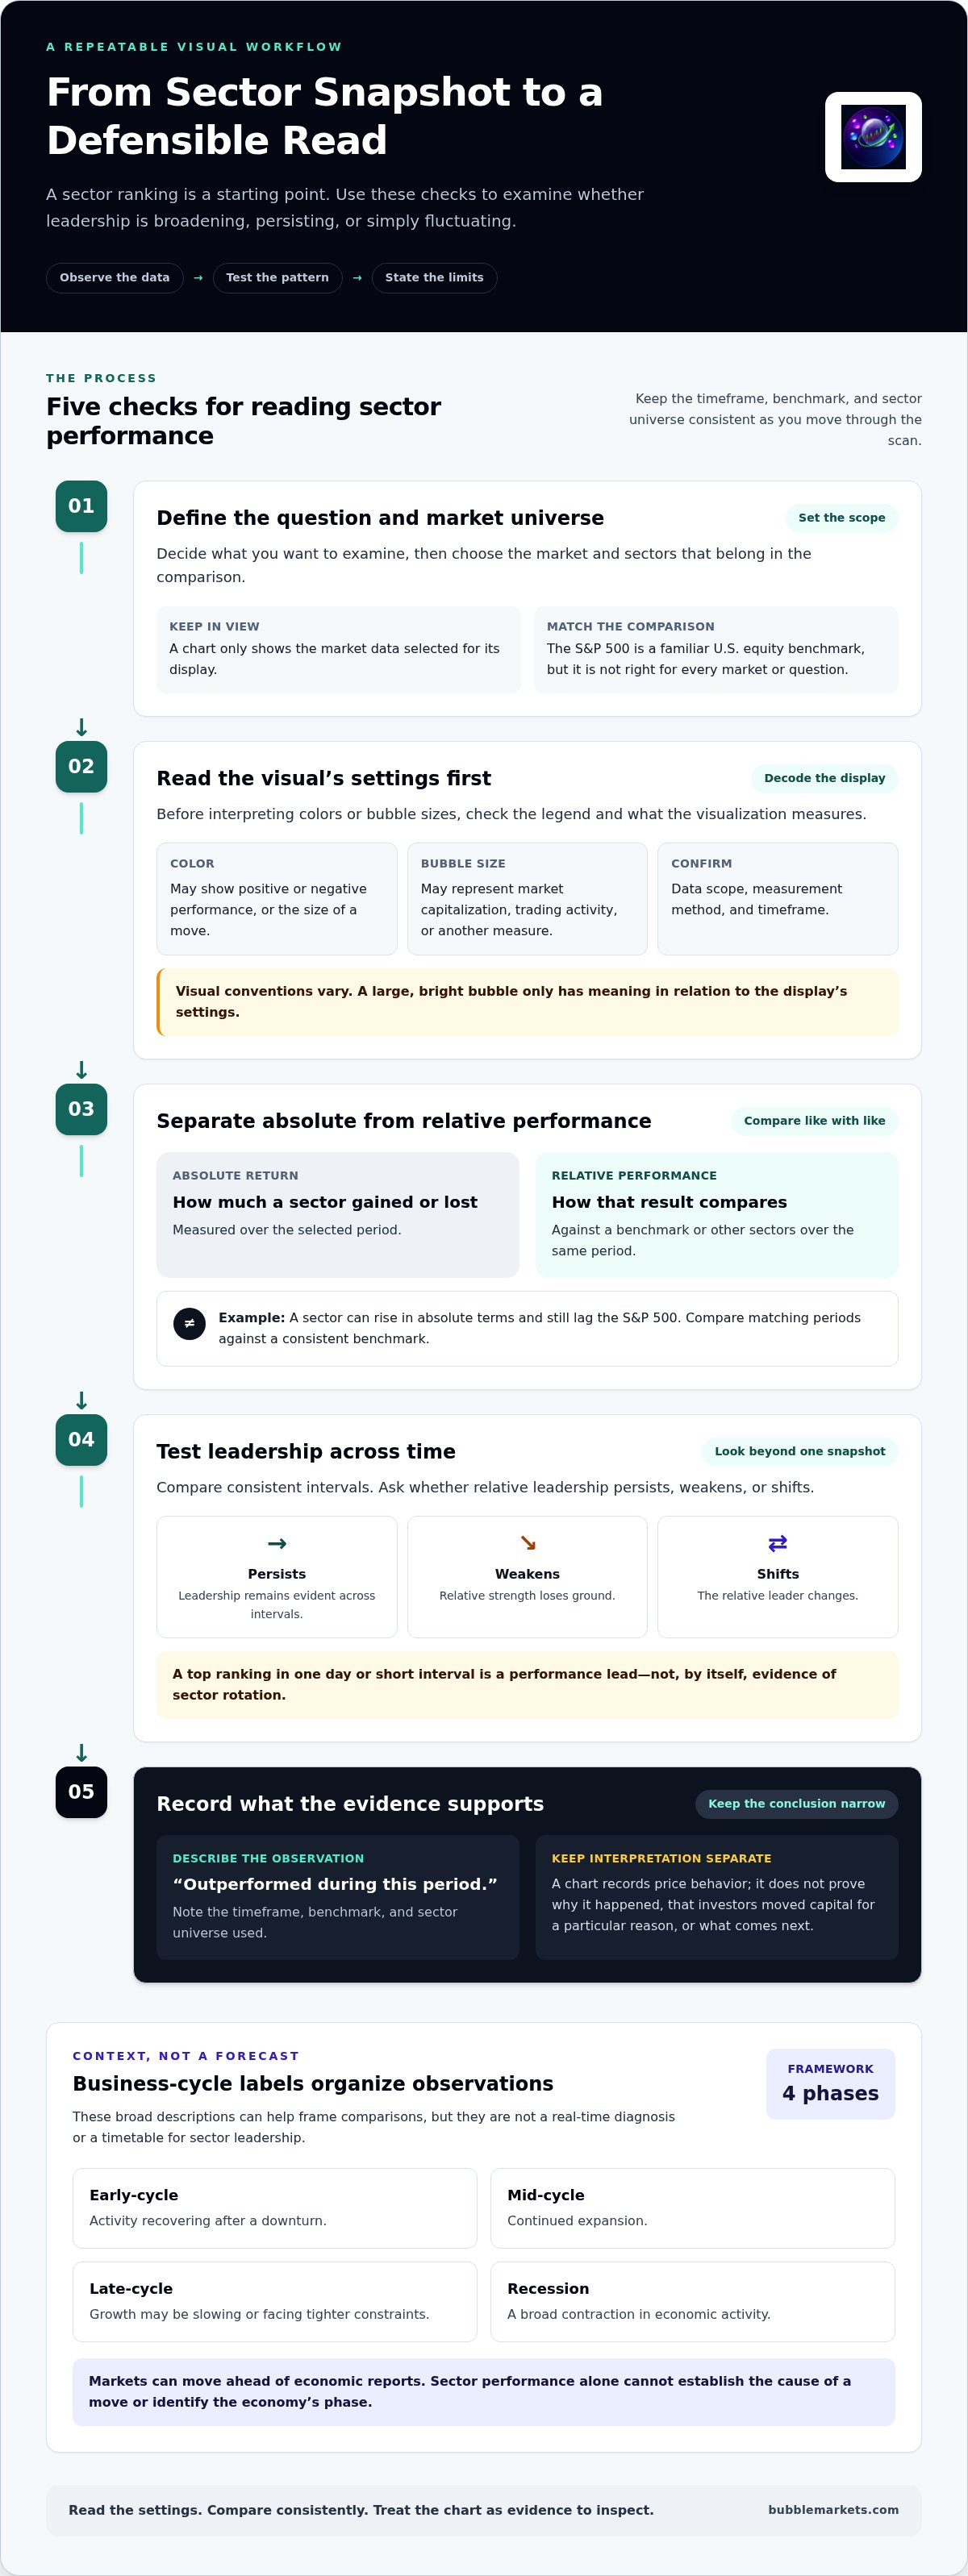
A repeatable visual workflow for examining possible sector rotation
Start with a question, not a chart setting. Are you checking which sectors have led over a defined period, or whether relative leadership has changed? Write that question down first. It gives you a reason to choose a particular market universe and timeframe, and helps prevent filter changes from quietly reshaping the conclusion.
Set up a consistent sector comparison
Define the boundaries of the scan. For example, an S&P 500 sector comparison covers sectors within that U.S. large-cap index, not every listed company or global market. Choose a benchmark that fits the universe and a timeframe that fits your question. A daily scan answers a different question from a multi-month review. Use a heat map or bubble map to spot patterns, then inspect the underlying data before interpreting them.
- Select the universe. Name the market and sector group you’re examining. Keep the scope fixed during the comparison so you don’t mix results from different sets of companies.
- Set the period and benchmark. Choose start and end dates, a return measure, and one benchmark. Note these settings so the result can be reproduced later.
- Compare the sectors. Identify leaders, laggards, and any close comparisons. Treat the display as a scan; check the figures behind a striking color or bubble.
- Check relevant context. Review factors that may help frame the observation, such as earnings developments, interest rates, or economic data. Context adds questions to investigate; it doesn’t prove what caused performance.
- Record the limits. Note missing data, a narrow date range, concentrated constituent performance, or any other limitation that could affect your reading.
Record observations without turning them into instructions
Keep the record descriptive. Include the date of the review, universe, timeframe, benchmark, return measure, leading and lagging sectors, and any data limitations. Add a separate note for interpretation, and label it as an interpretation. For instance, “Industrials outperformed the selected benchmark over this period” describes a comparison. A claim that the move signals a lasting economic shift goes beyond the observation.
Save the settings alongside the result. On a later review, reuse them before testing a different timeframe or benchmark. This makes changes easier to compare and reduces the risk of treating a new filter as fresh evidence. If you do explore another view, record what changed and why.
A visual guide to sector rotation is a research aid, not a set of buying, selling, or allocation instructions. A heat map can help organize market information, but color alone doesn’t establish breadth, cause, or durability. BubbleMarkets’ market visualizations provide a way to scan stocks and ETFs, then examine patterns as research context rather than as personalized financial advice or a trade signal. Explore BubbleMarkets’ interactive market maps to apply this scan to sector performance.
Using BubbleMarkets to scan sector performance visually
Interactive stock and ETF visualizations can help organize market data by segment, making relative performance easier to scan before you investigate individual holdings. Start broad: look at the overall market view, then narrow your attention to sector-level patterns. A visual can reveal which areas stand out in the selected view. It can’t, on its own, explain why they stand out or establish that leadership will continue.
Move from broad market context to sector-level detail
Keep the sequence simple: inspect the broader market, focus on sectors relevant to your question, then examine the stocks or ETFs within those areas. Before interpreting the display, read its legend and note the selected period. Color, bubble size, and performance values communicate different details depending on the view. For a wider overview of visual scanning, see the market bubble map guide.
Use the broad scan to form a question, not a conclusion. If one sector appears strong, check whether that strength is visible across its constituents or concentrated in a few. Then compare what you see with another period or a relevant benchmark. Keeping the market segment and timeframe clear helps you avoid treating different views as directly comparable when their scope has changed.
Keep heat maps and bubble maps in their proper role
Heat maps and bubble maps are formats for arranging and scanning data. They can make relative performance easier to view, but neither format predicts market outcomes. A heat map emphasizes patterns through color; a bubble map adds a visual size dimension whose meaning depends on the display. Use the legend and data values to understand what each mark represents before drawing a comparison.
For a focused walkthrough of heat-map scanning, consult the stock market heat map guide. The same discipline applies to either format: distinguish a visible pattern from an explanation, and treat a potential rotation as a question to examine rather than a forecast.
- Scan: Begin with the broad market, then identify sector-level differences.
- Adjust: Change the view only to answer a defined question, and note what changed.
- Investigate: Examine relevant constituents and compare the pattern with other periods or market context.
BubbleMarkets visualizes market data through interactive stock and ETF views. It doesn’t provide brokerage or advisory services, and its maps aren’t trade signals. Before drawing conclusions, verify the dates, data scope, selected period, and surrounding context. To explore the visuals directly, explore BubbleMarkets’ free live market visualizers.
Make your next market scan more deliberate
Let your next question guide the next chart you open. Rather than trying to name a definitive market phase, note what would change your interpretation: sustained relative strength, broader participation, or a reversal across the periods you’re tracking. That keeps the visual guide to sector rotation useful as an ongoing research habit, not a one-time verdict.
Interactive visualizers and heat maps can help you scan stocks, ETFs, and other global asset classes, while market screeners offer another way to explore areas that stand out. Use these tools to narrow your research, then assess the evidence and its limitations independently. A clearer view can sharpen the questions you ask; it can’t settle them for you.
Start with a focused scan and let the data point you toward what deserves a closer look. Explore BubbleMarkets’ free live market visualizers and continue your market research with a consistent, evidence-based approach.
Frequently Asked Questions
What is sector rotation?
Sector rotation is a change over time in which groups of companies lead or lag the broader market or one another. For example, if leadership shifts from technology stocks toward health care stocks across several measurement periods, that may indicate changing relative performance. The term describes a market pattern, not a guaranteed movement of money between sectors or a reliable forecast of what will lead next.
How can you identify sector rotation on a chart?
Use this visual guide to sector rotation as a comparison exercise: review sector returns over several periods and note whether the relative rankings change or persist. Then check whether a sector’s performance is broad or driven by a small number of companies. For instance, if a sector ranks highly but most of its constituents lag, its headline result may not represent widespread strength. Record the dates and comparison used.
Is sector rotation predictable from the business cycle?
No. Business-cycle models can help frame questions, but they can’t reliably identify the next sector leader. Markets may price expectations about growth, inflation, or interest rates before economic reports reflect them, and those expectations can change. A cycle label is best treated as one interpretation of conditions, not a timing signal. Compare it with observed economic data and market performance, and keep uncertainty explicit.
Which sectors tend to perform well in different economic phases?
Historical frameworks often associate economically sensitive areas, such as industrials and consumer discretionary, with improving growth, while consumer staples and health care are commonly viewed as more defensive. These are tendencies, not fixed outcomes. A company’s earnings outlook, debt, valuation, or business mix can lead it to behave differently from its sector peers. Use phase-based comparisons to organize research, not to assume a sector will outperform.
Can a heat map show whether a sector trend will continue?
No. A heat map summarizes selected market data for a chosen period; it doesn’t reveal future returns. A strong color may reflect a recent move, a particular metric, or the selected date range. To assess whether a pattern is persisting, compare other periods and inspect the companies represented. Treat the display as a way to identify areas for further research, not as evidence that a trend must continue.
What is the difference between sector rotation and sector performance?
Sector performance is the measured return of a sector over a defined interval. Sector rotation refers to a change in relative leadership across intervals. For example, financials gaining over a month describes performance; financials moving from lagging to leading across successive periods may suggest a leadership shift. The distinction matters because a single positive return doesn’t show whether a sector has changed position relative to peers or a benchmark.
How often should investors review sector performance visuals?
Choose a review interval that matches the question and intended timeframe. Someone studying short-term fluctuations may inspect a chart more often than someone comparing longer-term relative strength, but frequent checks can make ordinary daily changes seem meaningful. Set a consistent schedule, such as a weekly review for a medium-term comparison, and preserve the same benchmark and dates when comparing results. This makes changes easier to interpret without overreacting to each session.
Frequently asked questions
What is sector rotation?
Sector rotation is a change over time in which groups of companies lead or lag the broader market or one another. For example, if leadership shifts from technology stocks toward health care stocks across several measurement periods, that may indicate changing relative performance. The term describes a market pattern, not a guaranteed movement of money between sectors or a reliable forecast of what will lead next.
How can you identify sector rotation on a chart?
Use this visual guide to sector rotation as a comparison exercise: review sector returns over several periods and note whether the relative rankings change or persist. Then check whether a sector’s performance is broad or driven by a small number of companies. For instance, if a sector ranks highly but most of its constituents lag, its headline result may not represent widespread strength. Record the dates and comparison used.
Is sector rotation predictable from the business cycle?
No. Business-cycle models can help frame questions, but they can’t reliably identify the next sector leader. Markets may price expectations about growth, inflation, or interest rates before economic reports reflect them, and those expectations can change. A cycle label is best treated as one interpretation of conditions, not a timing signal. Compare it with observed economic data and market performance, and keep uncertainty explicit.
Which sectors tend to perform well in different economic phases?
Historical frameworks often associate economically sensitive areas, such as industrials and consumer discretionary, with improving growth, while consumer staples and health care are commonly viewed as more defensive. These are tendencies, not fixed outcomes. A company’s earnings outlook, debt, valuation, or business mix can lead it to behave differently from its sector peers. Use phase-based comparisons to organize research, not to assume a sector will outperform.
Can a heat map show whether a sector trend will continue?
No. A heat map summarizes selected market data for a chosen period; it doesn’t reveal future returns. A strong color may reflect a recent move, a particular metric, or the selected date range. To assess whether a pattern is persisting, compare other periods and inspect the companies represented. Treat the display as a way to identify areas for further research, not as evidence that a trend must continue.
What is the difference between sector rotation and sector performance?
Sector performance is the measured return of a sector over a defined interval. Sector rotation refers to a change in relative leadership across intervals. For example, financials gaining over a month describes performance; financials moving from lagging to leading across successive periods may suggest a leadership shift. The distinction matters because a single positive return doesn’t show whether a sector has changed position relative to peers or a benchmark.
How often should investors review sector performance visuals?
Choose a review interval that matches the question and intended timeframe. Someone studying short-term fluctuations may inspect a chart more often than someone comparing longer-term relative strength, but frequent checks can make ordinary daily changes seem meaningful. Set a consistent schedule, such as a weekly review for a medium-term comparison, and preserve the same benchmark and dates when comparing results. This makes changes easier to interpret without overreacting to each session.
Market information on this page is for education and general information only. It is not investment advice or a recommendation to buy or sell any asset.